

The Liquidity Inflection Point: NFP Trigger, NASDAQ/Microsoft Divergence, and Positioning for QE


Executive Summary
Welcome to this week’s comprehensive analysis of the macroeconomic forces shaping the markets, recorded on Wednesday, August 27, 2025. The current landscape is defined by anticipation, with major markets stagnating as participants await a critical data point that could unlock the next significant wave of liquidity. This analysis dissects the intricate relationship between the Federal Reserve's policies, bond market expectations, and the potential ripple effects across equities, bonds, and digital assets. We are navigating a complex environment where the Fed is committed to cutting rates but remains constrained by inflation concerns. The key question facing traders is: How do we position for the potential shift from monetary tightening to easing, and what are the triggers?
The central focus is the Effective Federal Funds Rate (EFFR). We know with great certainty that the EFFR is projected to steadily decline to somewhere between 3% to 3.25% (300 to 325 basis points) by around December 2026. This active cutting cycle directly impacts the US 10-year yield, which moves in lockstep with the EFFR. However, the Fed faces a significant dilemma: cutting rates is inherently inflationary. This pushes up inflation expectations currently at 2.5% on the five-year outlook, above the Fed's 2% mandate. The Fed is hawkishly monitoring these expectations and needs economic data to justify further easing or a reversal of the current $60 billion per month Quantitative Tightening (QT)program.
The pivotal catalyst for aggressive cuts and a potential liquidity flood via Quantitative Easing (QE) is the upcoming NFP (Non-Farm Payroll) data on September 4th or 5th. The market is looking for confirmation that the economy is weak, following previous NFP revisions that suggested things were “not as great as we were told.” A weak NFP print is necessary; without it, the Fed cannot aggressively cut without unanchoring inflation expectations.
In the equity markets, volatility remains unusually suppressed. The VIX is grinding at unusually low levels, a pattern that historically precedes explosive spikes. While the S&P 500 and NASDAQ are hugging all-time highs, a significant divergence has emerged, leading to the introduction of the "Lag Theory" by lead trader, Trader Pheneck. This theory posits that Microsoft is the leading stock for the algorithm running the NASDAQ. Currently, Microsoft is leading down, but the NASDAQ has not yet capitulated. Historical analysis suggests the NASDAQ will converge back to Microsoft, indicating a near-term capitulation is highly likely.
The implications of a shift to QE are profound. If the Fed initiates the liquidity pump as the Treasury is tapped out risk assets are expected to surge. As noted, “Once Fed does that, you will not be able to hold BTC back. BTC will go absolutely flying.”
Key Assets Poised for Movement:
Gold: Positioned as a hedge in a potential stagflation environment, currently in slow accumulation and expected to resolve higher.
US 2-Year Yield: Expected to trickle down towards 3%, offering bond traders 50 to 66 basis points of opportunity, especially if NFP data is worse than expected.
Bitcoin: Stands to benefit significantly from any Fed liquidity injection, with dominance levels suggesting potential aggressive accumulation points near 40%.

The Federal Reserve's Balancing Act: Rates, Yields, and Inflation
The macroeconomic landscape is currently dominated by the actions and communications of the Federal Reserve. Understanding their tools and their objectives is crucial to anticipating market movements across all asset classes. The Fed is attempting a delicate maneuver: supporting a potentially weakening economy through rate cuts while simultaneously preventing inflation expectations from becoming unanchored.
Understanding the Effective Federal Funds Rate (EFFR) Cycle

The Effective Federal Funds Rate (EFFR) is the primary chart indicating whether the Fed is hiking or cutting interest rates. It is, as described, a "mouthful," but it is a straightforward indicator:
If the chart goes up, the Fed is hiking (increasing interest rates).
If the chart is flat, the Fed is holding rates steady (doing nothing).
If the chart goes down, the Fed is cutting rates.
Federal Reserve actions tend to occur in distinct cycles either a hiking cycle or a cutting cycle aligned with the business cycle. They accommodate the economy when it is slowing down by cutting rates to make borrowing cheaper, aiming to extend the business cycle for as long as they can. It is highly unusual for the Fed to engage in a mixed hiking-cutting-hiking pattern, which may have occurred perhaps only once in the 1990s.
Currently, we know with great certainty that the EFFR is projected to steadily climb down. By around December 2026, the rate is expected to be somewhere between 3% to 3.25%, also referred to as 300 to 325 basis points. This projected decline will have significant ripple effects.
The Lockstep Correlation: EFFR and the US 10-Year Yield
Certain assets move in lockstep with the EFFR, particularly during an active cutting cycle. One of the most closely correlated is the US 10-year yield.
When the EFFR is rising, the 10-year yield moves with it. When the EFFR is flatlining, the bond market may do its own thing. However, when a cutting cycle starts, the 10-year yield tends to move down with it as well. It is highly unlikely that the 10-year yield will move significantly above the EFFR; it is expected to be “hugging that line.”
This dynamic means the Federal Reserve will guide the bond market lower. While sometimes it appears the bond market guides the Fed, they ultimately move in lockstep. If the bond market starts pricing in actions the Fed is not looking to take, the Fed will use communications either via Fed meetings or public statements to tell the market it is overcompensating and realign expectations regarding the magnitude of cuts. The insight here is clear: both the EFFR and the 10-year yield are heading lower over the next year and a few months.
The Critical Watch: Inflation Expectations and Fed Anxiety

Another crucial chart is Inflation Expectations, which represents the bond market's forecast of future inflation (one, two, five, or ten years out). While the Fed does not actively trade this, it is the most important macroeconomic indicator they monitor. The Fed is deeply worried when the market starts pricing in inflation that is way too high, as they do not want expectations to become unanchored.
The ten year inflation expectation is perhaps the most pressing right now. The bond market is currently signaling an expectation of 2.42% inflation over the ten-year term. This is an issue because the Fed's mandate is 2%. This gap signals that the Fed will do whatever it can to anchor expectations back down whenever this metric moves too far up.
The core problem the Fed faces is that when they start cutting rates, it automatically pushes inflation expectations back up. Cutting rates is inflationary. It may not cause inflation immediately, but it will cause inflation six months to a year from now. The only factor outside the Fed's orbit that brings inflation down is a weak economy where spending decreases, as seen in previous crises.
The Fed is hawkishly looking at the 10-year inflation breakeven. As observed back in March and April, when expectations jumped, the Fed pivoted and became very aggressive to bring them back down.
The Shift from QT to QE: A Liquidity Tsunami Waiting to Happen
The Fed has several ways to bring down inflation expectations and manage yields:
Communication: Telling the market the economy is terrible to get the bond market to buy into a deflationary outlook.
Holding Rates: Not cutting rates so inflation does not get hotter.
Active Involvement (QE): Buying bonds, which automatically suppresses yields in the market.
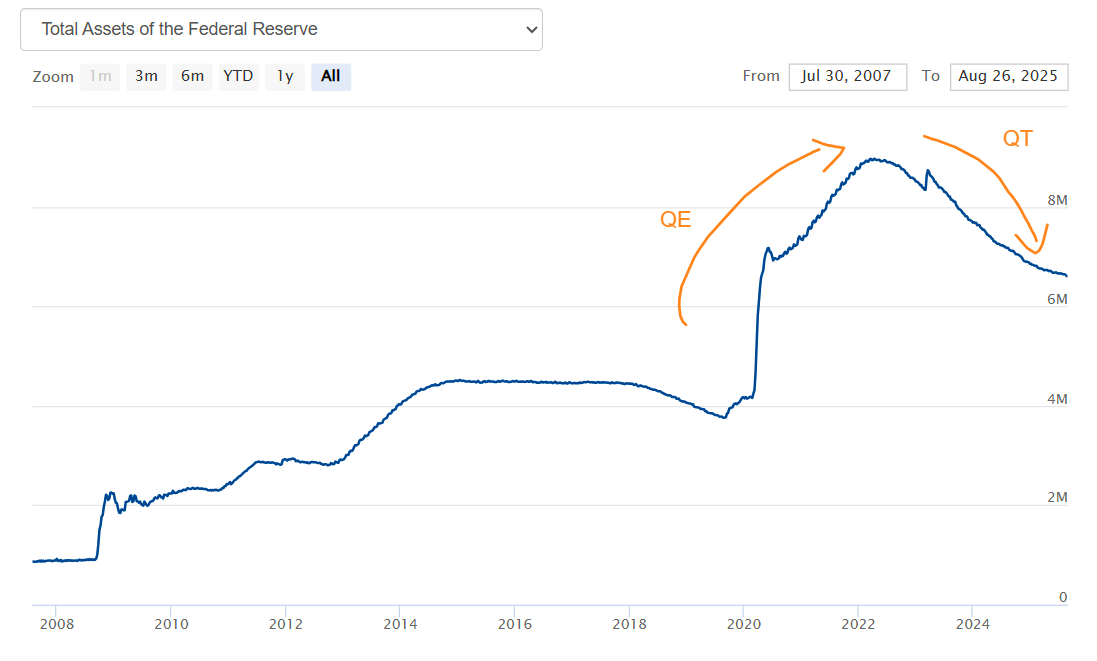
We have not yet reached the point where the Fed is actively buying bonds. Currently, the Fed is engaged in Quantitative Tightening (QT), where $60 billion a month is being taken out of the economy.
Once they reverse this by buying bonds back, they will initiate Quantitative Easing (QE). This shift would create loads of liquidity and mark a very interesting change in the market dynamic.
The Fed has already indicated they will keep cutting rates, likely in September and very likely in December as well. If the economy enters a recessionary situation, the Fed will start buying bonds again (reversing QT). It could almost be said that “the Fed is praying that the economy is actually terrible” so they can start implementing these liquidity measures, as they cannot do so without the data to support such actions.
The September Inflection Point: Waiting for NFP Confirmation
The triangulation of the Fed's likely actions points to a single, critical event that will determine the market trajectory for the rest of the year. The market is currently paralyzed, waiting for hard data to confirm the economic weakness required for the Fed to unleash liquidity.
The Importance of the September 5th Data Print
The trigger for everything bond buying (QE), yields coming down, and cutting rates more aggressively is going to be the NFP (Non-Farm Payroll) data released on the 5th of September.
The last NFP data release resulted in a massive candle on the EURUSD daily chart. Since then, the market, particularly the USD, has not done much. It is waiting to see if that data was real. The previous release included loads of NFP revisions that indicated the economy was “not as great as we were told.”
The market is now looking for confirmation that the situation is really as bad as expected, requiring another really bad NFP print.
The Stakes and Scenarios:
Scenario 1: Weak NFP Print: If we get the lower NFP print we are looking for, weakness is confirmed, the Fed becomes more active, and we move closer to the Fed switching from QT to QE a huge liquidity boost.
Scenario 2: Stable NFP Print: If the NFP print is not exciting, we return to trading the chop and must find other catalysts. The Fed cannot get aggressively cutting because it will push up inflation expectations without justification from the jobs market.
Market Paralysis and the Search for Liquidity
Currently, the most pressing thing is that data. This is why the majority of the market is “absolutely going nowhere” and nobody is pressing their longs. Everybody is waiting for the same thing: the hard data to confirm things are bad.
Everyone is waiting for the Fed to start the liquidity pump. The Treasury is tapped out and has no way of getting more liquidity. The focus is entirely on the Fed recognizing that things are not great. As soon as they have the data to show it, they can start pumping liquidity on a steady level, driving assets higher and potentially leading to a "Santa rally."
Equity Markets: Suppressed Volatility and the "Lag Theory"
The dynamics in the stock market are particularly intriguing. We are observing historical levels of suppressed volatility alongside a critical divergence among major indices and their leading components, suggesting a significant move is imminent.
Analysing the Unusually Low VIX
The VIX, the volatility gauge for the S&P 500, is highly suppressed. It is “unusually low.”
If the VIX goes up, volatility is high, which tends to be bad for the index.
If the VIX goes down, it is great, indicating passive buying.
The VIX has now been pressed down significantly. Previous patterns clearly show that whenever this grind continues at suppressed levels, something will cause it to explode. The longer the VIX stays at these suppressed levels, the higher the risk of massive spikes.
This is not necessarily an issue, but rather an opportunity. We are looking forward to one of those massive spikes because, in the current environment (awaiting potential Fed easing), we may be the buyers. Meanwhile, the S&P 500 and the NASDAQ continue to coast their all-time highs.
The NASDAQ/Microsoft Dynamic: Introducing the Lag Theory
A very interesting dynamic between the NASDAQ and Microsoft has led to the introduction of the "Lag Theory" (or time lag theory), developed with lead trader Trader Pheneckand detailed in this Substack by Speculator’s Edge.
The Lag Theory basically states that Microsoft is the leading stock for the algorithm that is running the NASDAQ. The NASDAQ's algorithm is set up to pick the highest capitalized stocks in the index and, majority of the time, just follows them, despite movements in other stocks.
Preparing for Convergence and Capitulation
We are now in an environment where Microsoft is leading down, but the NASDAQ itself has not capitulated. This capitulation is believed to be super near, and ideally, it happens quickly to see the touchback.
In the past, this divergence has happened “literally every single time,” and every single time, it seems to be the NASDAQ converging back to Microsoft, not the other way around.
While you cannot time these events precisely, understanding this dynamic allows traders to be prepared. When the convergence happens, you have more levels to work with, you can see the step-down occurring, and you see the VIX spiking. This may compel traders to short the NASDAQ.
Trade Setup: This setup is expected to be more of an intraday into a week trade, rather than a swing trade. Being prepared makes it easier to navigate the volatility and, most importantly, explain what is going on in the market so you are not panicking.
Key Asset Outlooks and Trade Ideas
Given the macroeconomic backdrop and the two potential scenarios depending on the NFP data, three assets are highlighted as likely to perform better regardless of the immediate outcome, but particularly well if the Fed initiates further easing.
Gold: A Stagflation Hedge in Accumulation
Gold is expected to work well, and we are currently long. The current breakout is believed to resolve higher due to the stagflation environment we seem to be in, even if it is short-lived. The chart looks like it is coiling higher.

However, the reason not to be aggressively long yet is that the momentum is not there. It is a slow accumulation phase. There might even be some spikes down, but eventually, it is expected to resolve higher. As a protective mechanism, gold remains a key holding, though it has recently been stagnant along with the rest of the market.
US 2-Year Yield: Trading the Bond Market (50-66 Basis Point Opportunity)
For bond traders, the US 2-year yield (US02Y) presents a clear opportunity. The two-year yield very closely follows where the rates are going to be. It is currently not pricing in where it should be, in our opinion.
The chart shows the yield trying to crack levels that it has not effectively cracked all year. Now, the yields are more likely going to trickle down all the way to 3%.
The Trade Setup:
Action: Buy the two-year bond (short the yield).
Potential Gain: There are 50 basis points, maybe even 66 basis points, to juice from this trade.
Catalyst: If the NFP data is horrendous (worse than thought), you could expect a 50 basis point cut, which will bring the yield down even further, which is "a lot of fun to trade."
Bitcoin: Primed for the Liquidity Injection
Bizarrely, Bitcoin (BTC) is another asset expected to hold up well. If the idea that the economy is stalling and needs help from the Fed to re-accelerate is correct, that extra liquidity will find its way into assets like Bitcoin.
If the Fed switches from QT to QE, providing a huge liquidity boost, you will not be able to hold BTC back. “BTC will go absolutely flying because the liquidity injection it will get.”
Is it time to aggressively go long Bitcoin yet? We must look at the context. Bitcoin is considered a great play either way. It is a great buy within the current zones and is expected to scoop up and attack higher levels again.
If the economy is not as bad as expected, BTC should continue to chop about.
Once we get a liquidity injection from the Fed, you won't be able to catch it anymore; it will move to a different level.
Bitcoin Dominance and Potential Dip Buying
Looking at cross-currency metrics, Bitcoin dominance is currently “down the gutter.” This is good news because it is coming to a point where it tends to be supported, having previously found a ceiling on the bigger timeframe.

How far can it drop? Realistically, it could drop all the way to about the 40% level. That is the point where you want to get aggressively long again.
If we see pain in the economy (e.g., a bad NFP print), the Fed will not react the same day. We will still see short-term pain. Hopefully, this means the NASDAQ will touch base with Microsoft, and Bitcoin might see another dip as well. This would provide the opportunity to buy BTC way lower. While a drop to 40% dominance is not guaranteed, if it does happen, it is a signal to get way more aggressive.
Trading Philosophy: The Requirement of Doing Nothing
A critical takeaway for all market participants concerns the psychology and reality of trading, which often conflicts with thinking patterns brought from previous professions. Many believe that the input and the amount of work done should always result in actionable trade ideas and results.
The reality of trading is different. Doing nothing does not mean you are wrong. It does not mean somebody else is better than you. It is okay to literally do nothing in trading; “It is a requirement, as a matter of fact.”
Traders must learn when to do nothing and when to “press our luck.” Sticking to this principle will lead to significantly better financial outcomes seeing so much more money than ever before.
If you are constantly hunting for trades because you feel ready, letting emotions flood your decision making rather than following your process, it is going to become very painful very quickly. Do not do yourself any harm.
Key Principles for Success:
If you have a setup that works, by all means, go for it.
Know your environment.
Understand the environment. That is where you make the most of your money.
Key Takeaways and Outlook
As we head into September 2025, the market is clearly defined by the anticipation of the NFP data on September 5th. This data print is the inflection point that will determine whether the Federal Reserve accelerates its cutting cycle and potentially reverses the $60 billion/month QT into QE.
The macroeconomic environment suggests that the Effective Federal Funds Rate is heading towards 3%-3.25% by December 2026, pulling US yields down with it. However, the Fed remains constrained by inflation expectations hovering at 2.5%, requiring weak economic data to justify further easing.
Equities are flashing warning signs. The VIX is unusually suppressed, historically indicating an explosive spike is imminent. Furthermore, the "Lag Theory" highlights a critical divergence where the NASDAQ has yet to follow Microsoft lower. A capitulation in the NASDAQ to converge with Microsoft is expected in the near term.
Key assets to watch include Gold (as a stagflation hedge), the US 2-Year Yield (targeting 3%), and Bitcoin, which is primed to "absolutely fly" upon any significant liquidity injection from the Fed.
The current environment demands patience. August has been a chop fest, and recognising that doing nothing is a requirement in trading is the best strategy until the September data provides confirmation.
Disclaimer: This isn't financial advice – just market musings from the charts. Always do your own research.
If you enjoyed this deep dive, please share it with fellow traders!
Love how you broke down the liquidity inflection points — it really does come back to flows driving everything. TCLM (Trade Credit & Liquidity Management) covers the financial side of liquidity and credit risk, might be interesting for you if you’re exploring this further.
(It’s free)- https://tradecredit.substack.com/subscribe