

The Macro Breakout Begins
Ethereum, Microsoft and AI Surge

TLDR; Navigating the Global Melt-Up Phase
Welcome to the detailed breakdown of our 17th livestream session. Building on the foundation laid in our recent Quarterly Outlook Report this analysis dives deeper into the actionable weekly setups aligning with the broader macro trends. The current landscape is characterized by a global melt-up phase, supported by loose monetary policy and the anticipation of rate cuts. In this context, the single largest risk facing investors is not a market crash, but rather not being in a position to capture the explosive upside. This post details the high-conviction positions being initiated, the methodologies behind them, and the catalysts driving these moves into Q4 2025 and Q1 2026.
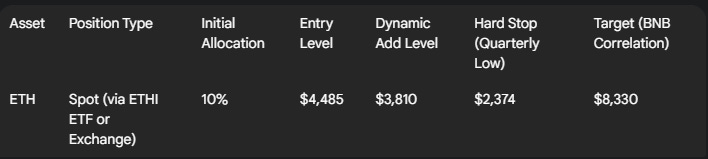
In the cryptocurrency sphere, the focus is sharply shifting to Ethereum (ETH). While Bitcoin (BTC) plays catch-up to the NASDAQ, supported by institutional flows visible in the IBIT ETF maintaining its monthly structure, Ethereum has confirmed a critical Inside 3-Week (3-Week) Candle Failure. This pattern signals what may be the last opportunity to acquire ETH below its previous all-time high (ATH). We are initiating a 10% spot position at $4,485. This move is strongly supported by Binance Coin (BNB), which has already broken out of a massive 4-year (1,500-day) macro range and rallied 70%. If ETH follows this cross-market correlation, it implies a target of $8,330.
In US Equities, conviction is heavily concentrated in technology leaders poised for explosive growth and currently lagging the broader index. Microsoft (MSFT) is our highest conviction play, commanding a significant 30% portfolio allocation. Based on an Inside Monthly Candle Failure and strong 3WE expansion, MSFT is poised to rally ahead of earnings, driven by a “revenue explosion” from its 49% stake in ChatGPT and the launch of Sora 2. We project a catch-up trade towards $555 to $600, correcting after an insane 42% rally in 3 months for the $3.8 trillion company. Netflix (NFLX) also presents a high-probability setup, triggering a long entry based on an Inside Two-Month Candle Failure right at macro trendline support dating back to June 2022. With earnings on October 21st acting as the catalyst, we have allocated 10% using March 2026 options, targeting a potential 170% return.
Underpinning these positions are two critical methodologies detailed exhaustively in this analysis: the Quarterly Candle Strategy and the 3WE Strategy. We explore how the Quarterly strategy allows traders to capture multi-year bull runs by identifying macro trend shifts (waiting for the previous quarter’s high to be breached) and managing risk through dynamic trailing stops, demonstrated by historical examples in Solana (from $20 to $260) and Bitcoin (from $21k to $100k, a 5x return). The 3WE strategy is highlighted as the preferred navigation tool for US equities.
Globally, the recent Japanese elections are injecting significant liquidity. The new leadership’s commitment to further Yen devaluation is driving USD/JPY towards the yearly resistance at 152. This is profoundly bullish for the Nikkei, and due to their near 100% correlation, bullish for the NASDAQ and global risk appetite.
What does this confluence of technical breakouts and macro liquidity mean for your portfolio?
Key Takeaways from this Week’s Analysis:
Ethereum Entry Triggered: Inside 3WE Failure confirms a long entry for a 10% spot position, targeting $8,330 based on BNB correlation.
Microsoft High Conviction: 30% allocation targeting $600 as MSFT plays catch-up to NASDAQ, driven by AI revenue and technical breakouts.
Netflix Options Play: 10% allocation in March 2026 options based on Inside Two-Month Failure, anticipating an earnings catalyst.
Global Liquidity Injection: Japanese election results support the global risk-on melt-up via the Nikkei/NASDAQ correlation.
Strategic Positioning: The focus is on maintaining core positions in high-conviction assets rather than attempting to time the market perfectly.
If you’re finding value in our research, we’d like to extend a personal invitation to explore the next level of market analysis within our Speculators Trading community. Our Discord server is a collaborative space dedicated to helping traders optimize capital allocation. Inside, you’ll gain access to our real-time Trading-floor commentary, high-conviction technical setups, proprietary educational resources, and strategic bi-weekly livestreams. We invite you to experience these premium resources firsthand and see how they can enhance your portfolio management. Join us with a 14-day free trial (120 USD/month after trial is over), you can cancel anytime, but we would love for you to stay.

Crypto Market Analysis: The Macro Breakouts Begins
The Q4 outlook remains heavily bullish for risk-on assets. The premise is clear: if NASDAQ, Microsoft, and gold are bullish, then crypto the mother of all risk-on assets must catch up. We are now seeing critical breakouts across the majors, signaling the next phase of the bull run, with Ethereum poised for a significant move after nearly three years of consolidation.
Bitcoin (BTC) and IBIT: Institutional Flow and the NASDAQ Catch-Up
A crucial observation involves the discrepancy between the Bitcoin futures chart and the IBIT (Bitcoin ETF) chart, which represents institutional order flow. On the BTC futures chart, a specific monthly low was recently taken out. However, “if you go on the IBIT chart... there was no monthly low which was taken out.”
This is highly significant. It means the core monthly market structure remained intact on the institutional side, confirming a higher low. Following an inside monthly candle, this strongly suggested the market would rally and take out the inside monthly candle’s high.
The Unusual Lack of Retracement:
The market reaction was aggressive and unusual for the start of a new quarter. Bitcoin opened with a gap up and moved straight toward all-time highs without any retracement or “bottom wick” formation. While annoying for traders waiting for an entry, this aggressive price action highlights the underlying strength during this Q4 seasonality phase.
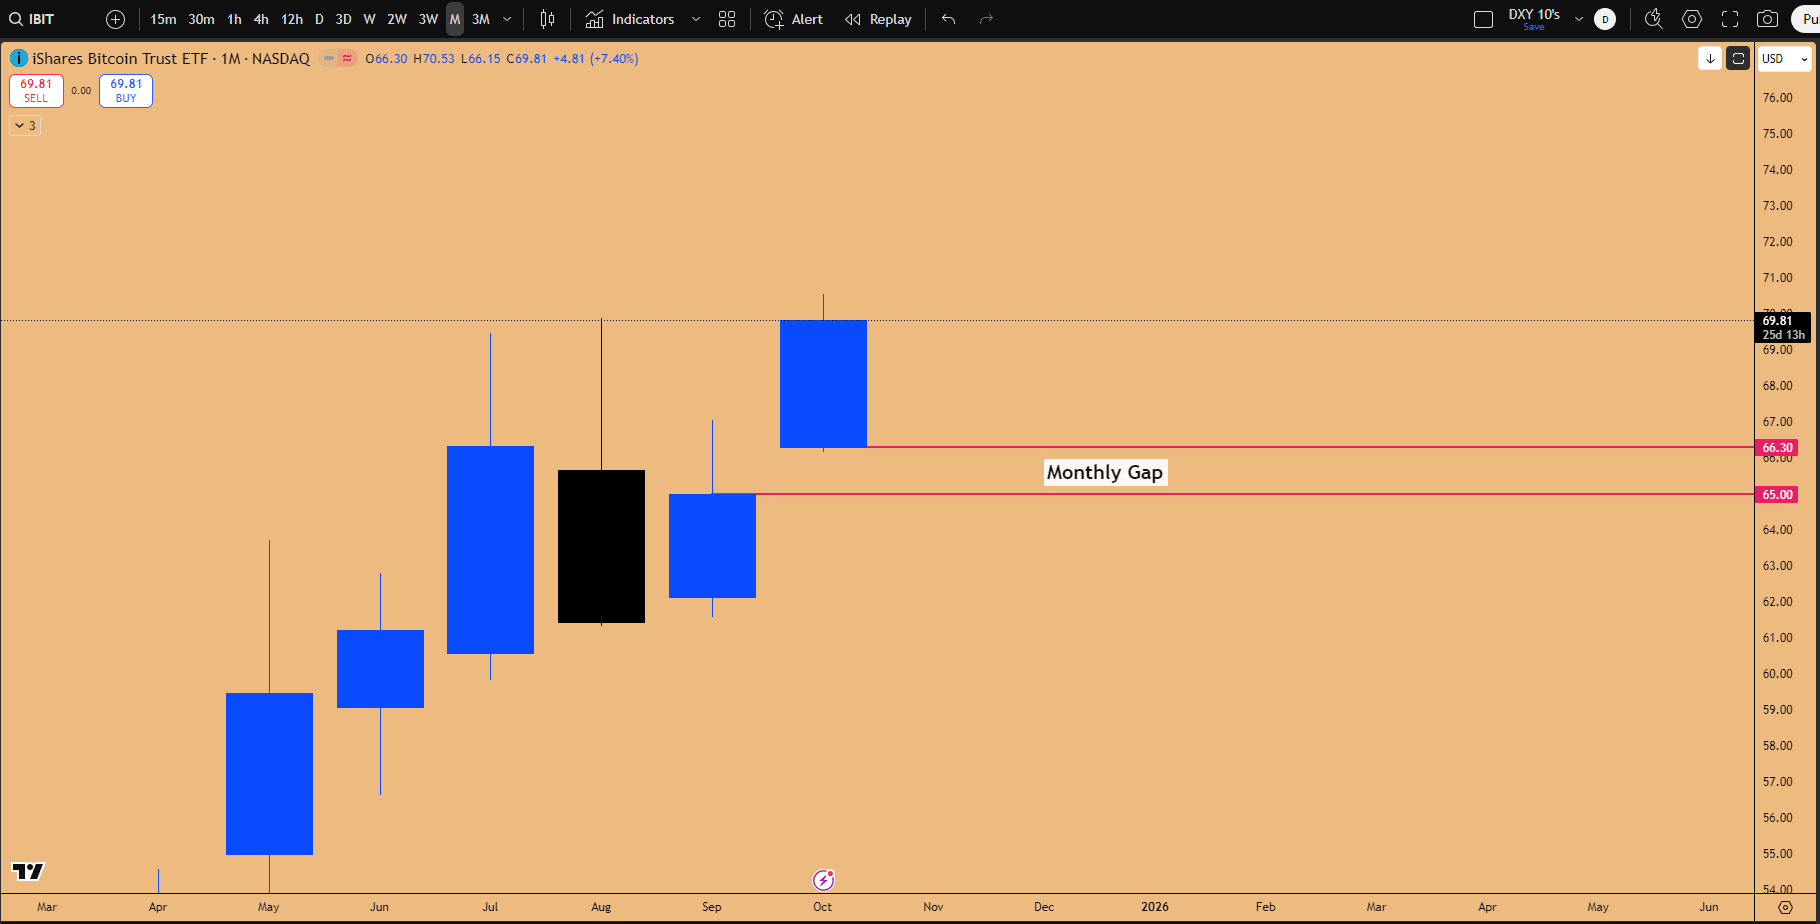
Figure 1 : Open Gap on the Monthly/Quarterly chart on IBIT (Bitcoin’s ETF)
The NASDAQ Correlation:
Bitcoin has historically moved in tandem with the NASDAQ index but has recently been lagging. During periods of consolidation in Bitcoin (e.g., July 14th to September), the NASDAQ often continues to print higher highs. This divergence provides actionable signals. When NASDAQ breaks out and signals it wants to go higher after printing a bullish order block, traders can long Bitcoin and play a catch-up trade. The recent surge in Bitcoin is this catch-up trade playing out.
Ethereum (ETH): The “Last Opportunity” Below All-Time Highs
While Bitcoin did not offer a clean entry trigger, Ethereum is presenting a confirmed, high-probability setup: the Inside 3-Week (3WE) Candle Failure.
This confirmation signals the initiation of a spot long position. This is viewed as potentially the “last opportunity you’re probably going to get to buy Ethereum below the previous all-time high.” With Bitcoin and BNB already sitting at ATHs, it is only a matter of time before Ethereum follows. Once it crosses that major SR level, the chances of the market coming down below all-time highs in the future become very low.
Historical Precedent: The Bitcoin 2020 Breakout:
This pattern near ATHs mirrors Bitcoin’s behavior in December 2020. Right before hitting ATHs, BTC underwent a sizable pullback, making participants believe it was topping out. It then formed a wedge formation right at the resistance level. Once the wedge broke out, the market “went berserk,” offering no retest and moving straight up toward the $69,000 top. Ethereum is likely sitting at a similar inflection point, poised to potentially double.
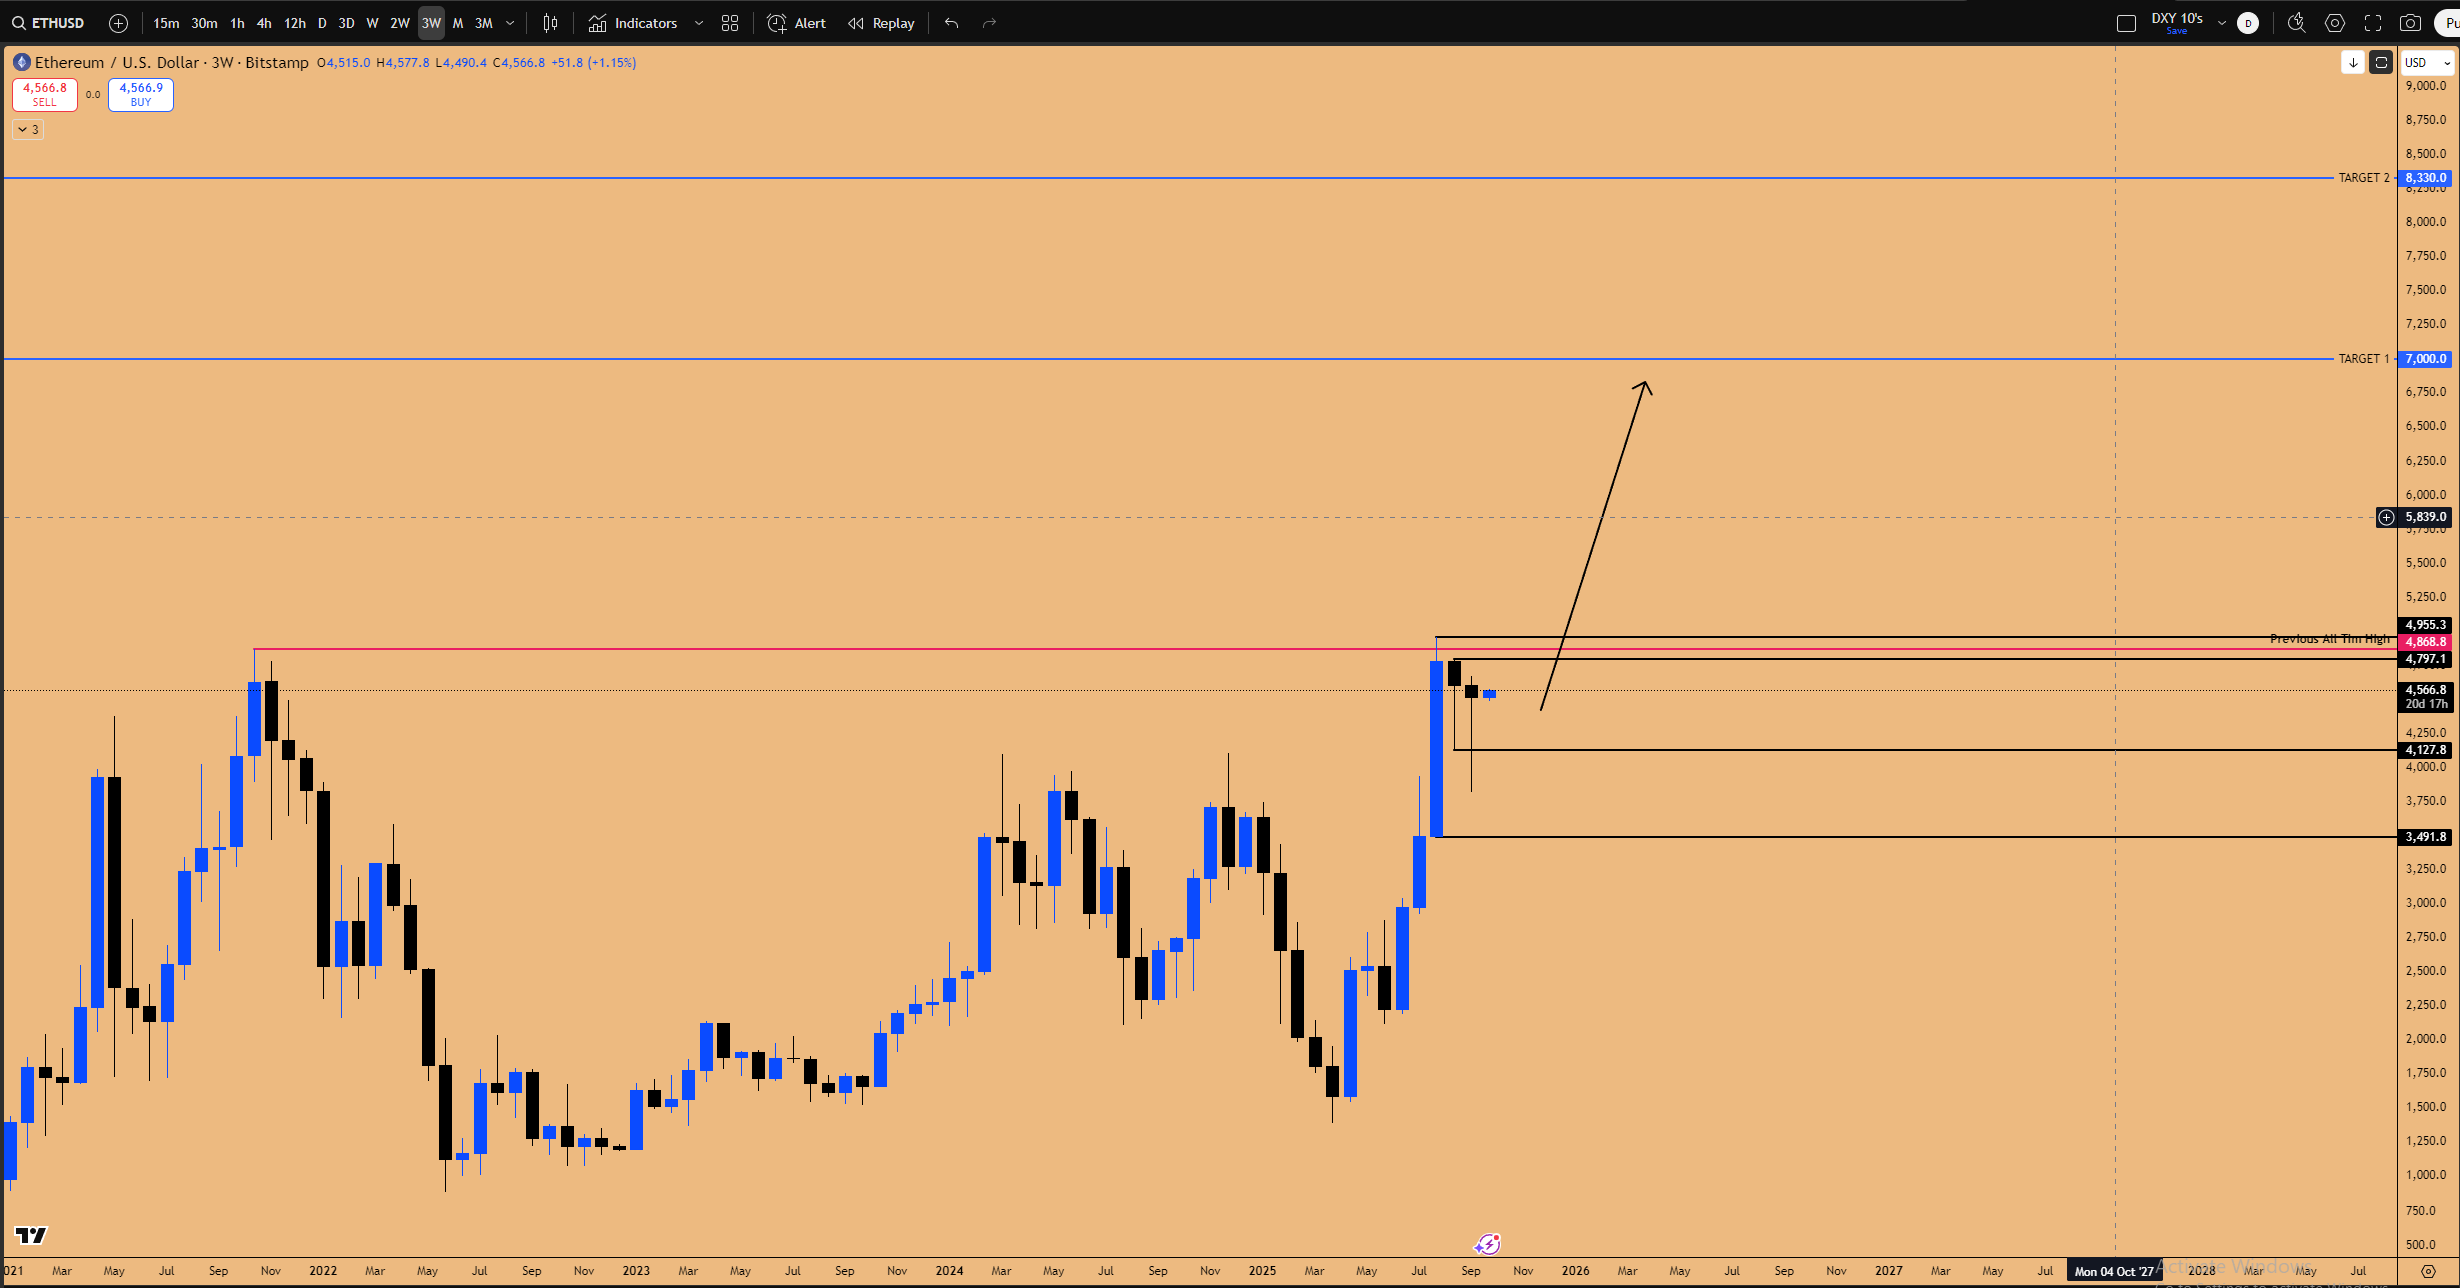
Figure 2: Massive 3 year long Range Breakout Ready to happen on ETHUSD
The BNB Parallel and Ethereum’s $8,330 Target
The recent performance of Binance Coin (BNB) provides a powerful cross-market correlation signal. BNB is undergoing an incredible move, breaking out of a range that began in April 2021—a massive 4-year (1,500-day) range breakout.
BNB is currently sitting at a 70% return from this macro range breakout. Recognizing that the range structure in ETH/USD is the same as in BNB/USD, Ethereum is expected to follow suit.
By applying this cross-market correlation, a 70% return on Ethereum from its range high breakout projects a target price of approximately $8,330. Given this potential doubling in price, the emphasis shifts from timing the perfect entry (whether $4,500 or $4,000) to ensuring participation. The entire risk in the market right now is not being in a position.
Ethereum Positioning Strategy and Risk Management
Ethereum is the alpha asset class beginning to catch up, and the strategy is designed to capture this move over the next 4-6 months, holding the spot position until July next year.
Risk Management Details (Q&A Insight):
The risk management for the Ethereum spot position is dynamic, recognizing the volatility within the current inside monthly candle structure.
Sizing Up on Dips: The 10% allocation is a starter position. If the market pulls back and executes a stop run below the inside monthly candle low at $3,810, an additional 10% risk will be added to size up the spot position. We do not place the stop immediately below $3,800 because a stop run is possible.
Static Stop Loss (Positional): The ultimate invalidation is below the previous quarter’s low at $2,374 (or $2,370). If this level is breached, the entire bullish market structure characterized by successive higher lows on the quarterly chart banging into the $4,380 resistance—is invalidated, signaling a potential bear market.
Aggressive Stop Loss (Daily Structure): A tighter hard stop can be placed below the daily support zone at $3,539. If this support breaks, the immediate bullish structure of higher lows from the recent bottom would be broken.
Dynamic Trailing Stop: The stop loss will only be trailed up (e.g., below $3,800) once the 3WE candle expands higher, breaks above all-time highs, and closes above them.
Altcoin Analysis: Selective Opportunities
If Ethereum initiates its macro breakout, several altcoins are poised to follow. However, the strategy remains selective, focusing major risk allocation behind Bitcoin and Ethereum, while using prop firm accounts for leveraged altcoin exposure (capped around 2% risk).
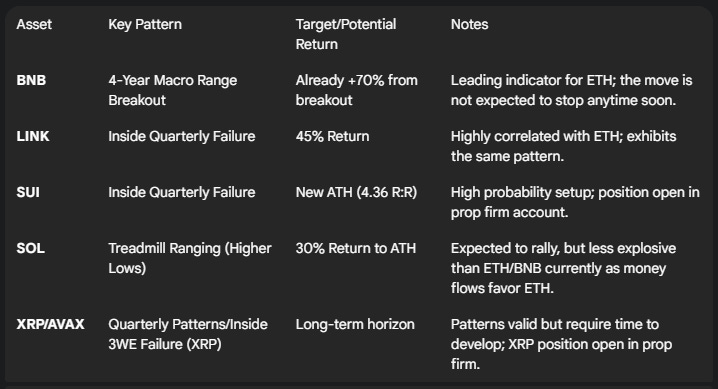
Solana (SOL), while expected to rally as it seems “written in its algorithm that it has to go and take out the all-time highs,” is currently ranging upward (”treadmill ranging”). It will eventually chug along to ATHs, but may not deliver explosive returns immediately.
US Equities: AI Dominance and Earnings Catalysts
The outlook for US equities remains robust, driven by strong Q4 seasonality, consumer spending trends (benefiting companies like Apple and Costco), and the ongoing AI revolution. Our strategy focuses on high-conviction plays in market leaders currently undervalued relative to the broader index and their own growth trajectories. We differentiate between A+ setups discussed in the Quarterly Outlook (e.g., inside quarterly candles on Netflix and Costco) and the weekly entries discussed here.
Microsoft (MSFT): The $600 Catch-Up Trade (30% Allocation)
Microsoft (MSFT) represents our highest conviction trade, commanding a significant 30% capital allocation. This conviction stems from a confluence of fundamental catalysts and powerful technical patterns. We are already positioned long from the 498 low.
Technical Setup and 3WE Expansion:
The entry was based on “bread-and-butter” patterns: the Inside 3-Week (3WE) Candle Failure and the Inside Monthly Candle Failure. The current stop loss is sitting below $491, based on the monthly pattern.
Crucially, the most recent 3WE candle closed after taking out the nearest lower high in the market structure. This is a significant change in market structure to the bull side on the 3WE timeframe, indicating that the coming 3WE candle is poised for further upside expansion.
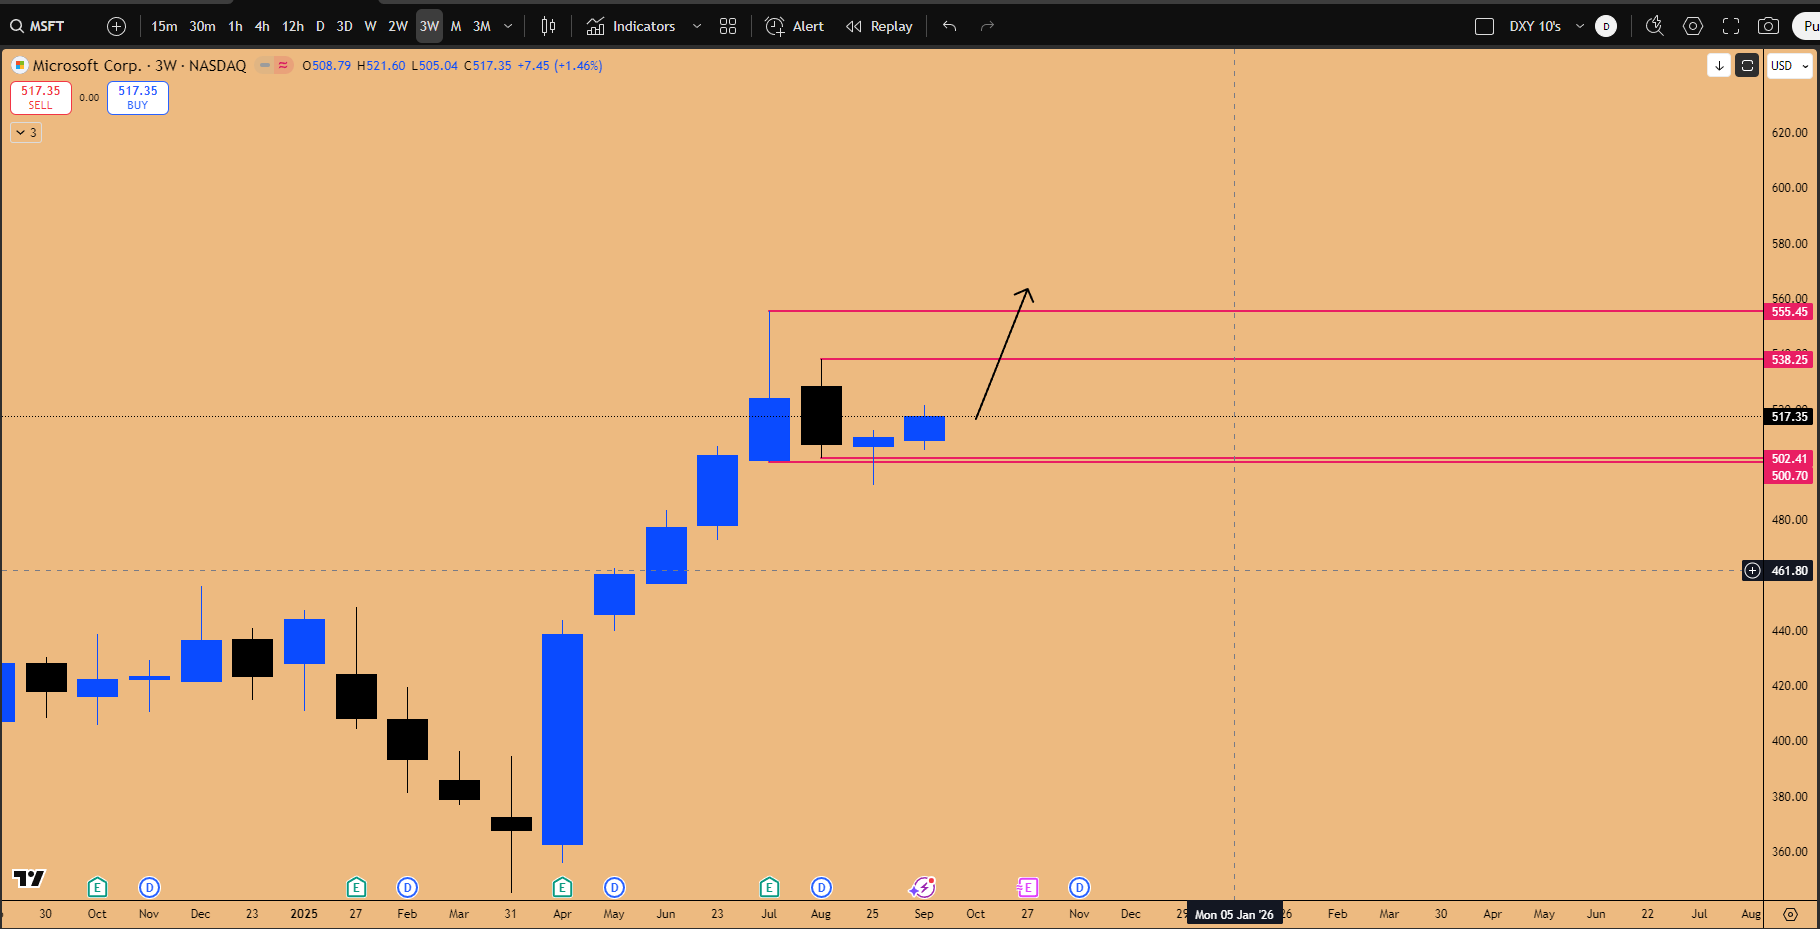
Figure 3: Inside 3-week candle failure pattern primed for expansion higher
The NASDAQ Correlation and Valuation Gap:
Microsoft is the alpha for NASDAQ, yet it is significantly lagging the index. Following the last earnings report on July 31st, MSFT sold off and flatlined. During the same period, NASDAQ rallied far beyond the high printed during the MSFT earnings.
This divergence indicates a significant catch-up trade opportunity. The stock recently underwent a technical correction after an explosive 42% rally in just 3 months. For a company with a $3.8 trillion net worth, this magnitude of movement is “borderline insane.” After consolidating for 2-3 months, MSFT must start rallying immediately to catch up.
Based on the previous earnings beat, the true value should be around $555. However, given NASDAQ’s current levels, Microsoft’s true value might be sitting closer to $600.
Earnings Catalyst and AI Revenue Explosion (Q&A Insight):
We anticipate a rally ahead of the earnings report, rather than sideways trading. The market participants already anticipate strong results and will likely start front-running the announcement.
The primary driver is AI. “Microsoft is actually just ChatGPT at the moment.” Microsoft holds a 49% revenue share agreement with ChatGPT. The recent launch of Sora 2 is expected to drive an “insane amount of revenue.” The massive gap up on the July 30th earnings report confirmed the positive trajectory, and earnings have likely accelerated since then due to the pace of AI advancement.
Netflix (NFLX): Trading the Earnings Cycle and Two-Month Pattern
Netflix presents another high-probability setup, warranting a 10% portfolio allocation. A critical long-term pattern was recently triggered.
The Technical Trigger:
The primary setup is the Inside Two-Month Candle Failure. A recent pullback (attributed to comments by Elon Musk) delivered the entry trigger by taking out the inside two-month candle low. This also triggered an Inside Quarterly Candle Failure (inside three-month candle). In a raging bull trend, this pattern is highly reliable.
The Earnings Catalyst (October 21st):
This entry trigger occurred right ahead of earnings, scheduled for Tuesday, October 21st. Historically, Netflix trades from one earnings report to the next. Corrections typically begin at an earnings report and end at the next one, which then provides the acceleration trigger. The recent corrective phase started near the last earnings report. The upcoming report is expected to be the catalyst that initiates the next acceleration phase.
Trend Line Support:
Netflix is currently sitting very close to a macro trend line support dating back to the June 2022 low. This is the area to long the support within the established uptrend channel. Furthermore, a daily Swing Failure Pattern (SFP) was printed last Thursday, providing an additional long trigger.
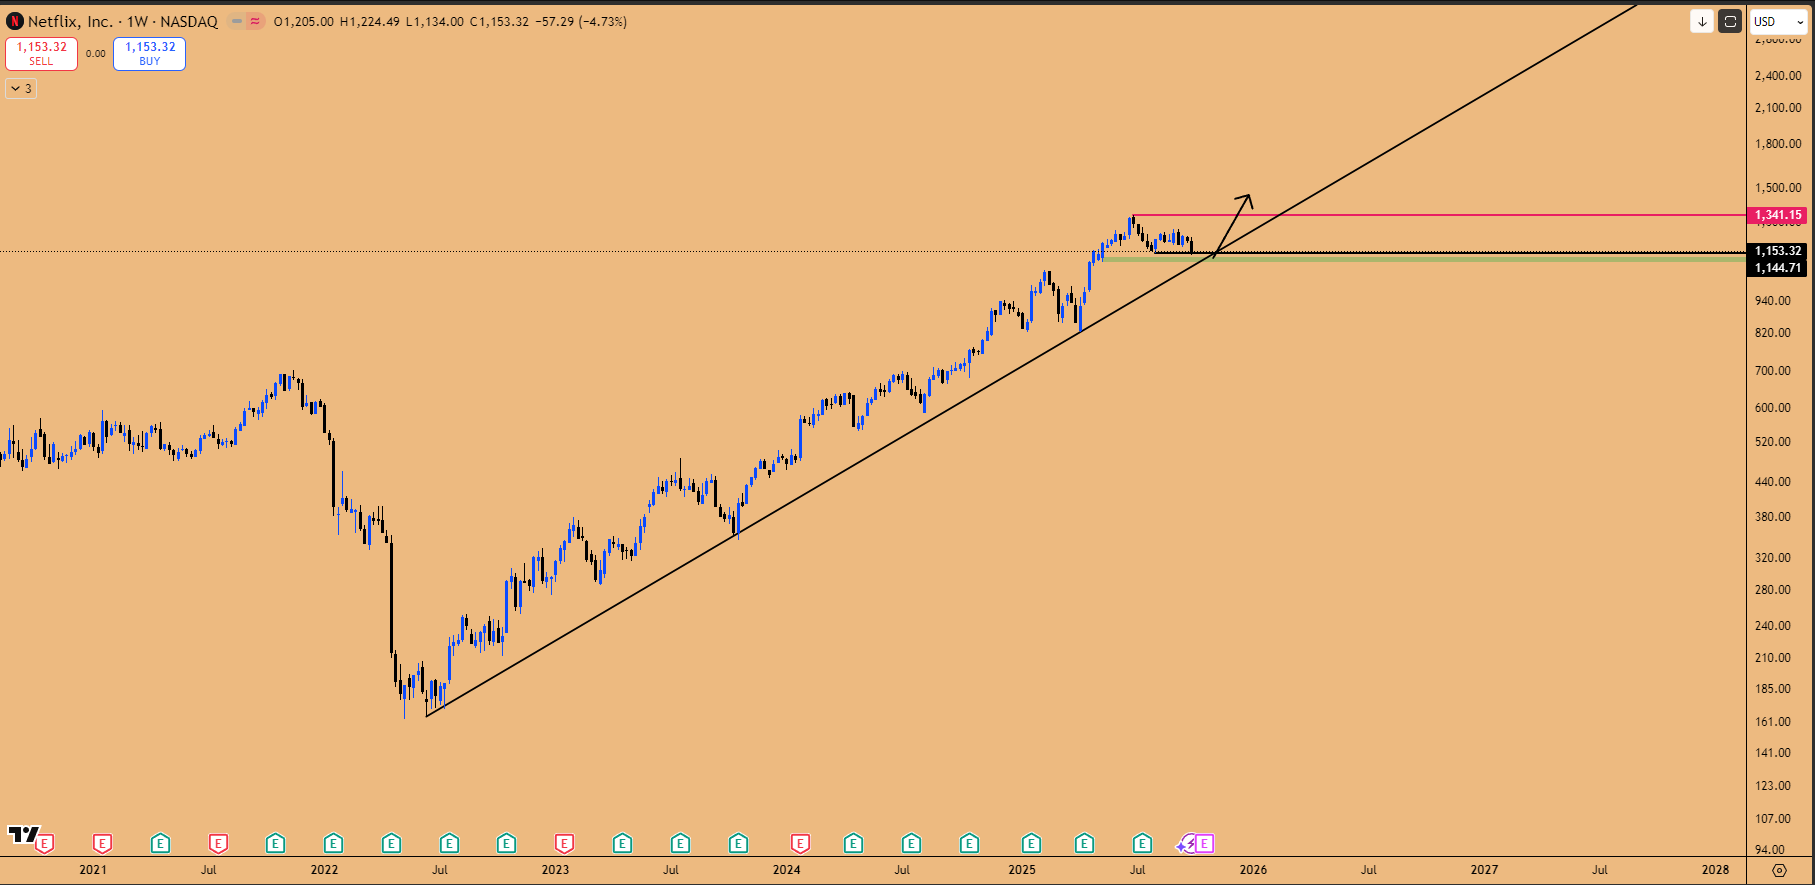
Figure 4: NFLX core uptrend intact, at macro support trendline
Netflix Options Strategy:
Given the lucrative risk-reward ratio, we utilized a long-dated options strategy to capture the move. The disparity in sizing (30% in MSFT vs. 10% in NFLX) reflects the relative conviction in the Microsoft setup.
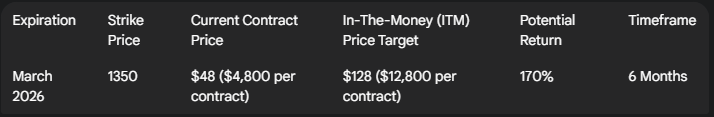
This strategy provides ample time for the pattern to play out, though the move is expected to occur within one or two months. The stop loss for the swing trade is below $1,100, while a positional stop would be below the quarterly low at $821.
Sector Rotation: Nvidia’s Plateau and Capital Flows (Q&A Insight)
While the overall tech sector remains bullish, understanding the internal rotations is crucial. Nvidia (NVDA), with a market cap of $4.56 trillion, has been the primary driver of the NASDAQ’s rally. However, the stock appears overstretched.
The NASDAQ index has printed eight consecutive bullish 3WE candles. Historically, such streaks (like the one from the 2023 bottom) are followed by a pullback. The index is way too overstretched, and one or two 3-week down candles are warranted. This pullback in the index is likely to be driven by Nvidia, not Microsoft, which still needs to catch up.
Capital is expected to rotate from Nvidia into companies that are relatively undervalued but still participating in the AI revolution. Liquidity will not flow out of tech; it will rotate into Microsoft, Amazon (AMZN), Meta (META), and Netflix (NFLX). This interconnectedness means that when one outperforming company “takes a chill pill” (like Google and Apple recently), the money flows into the companies that have been undergoing a correction. We are avoiding new positions in NVDA now, but if a pullback presents itself, that would be the time to go all in.
Global Macro View: The Japan Catalyst and Currency Dynamics
The global macro environment continues to support the risk-on thesis, driven by monetary policy expectations and significant geopolitical developments, particularly in Japan, which are injecting liquidity into the global system.
The Japan Effect: USD/JPY Surge and Nikkei/NASDAQ Correlation
The most significant macro development this week stems from the Japanese elections, which have profound implications for global risk appetite.
USD/JPY and Yen Devaluation:
USD/JPY opened the week with a massive 180 pip gap up, reacting to the election results. The new leadership in Japan is expected to implement aggressive fiscal policies—running the economy hot, printing money, and further devaluing the Yen.
This is bullish for USD/JPY. The target is the critical yearly S/R level at 151.946 to 152. This level has acted as significant resistance multiple times historically on the quarterly chart. We remain bullish until this target is reached (another 262 pips upside).
Nikkei and the NASDAQ Correlation:
If USD/JPY goes up, the Nikkei index goes up. The market anticipated the results, rallying last week based on an Inside Weekly Candle pattern and a daily SFP long trigger. Crucially, the Nikkei is a proxy for the NASDAQ index, sharing a near 100% correlation.
If the Nikkei continues to perform well due to the increased liquidity injection in Japan, this liquidity will have reverberation effects and flow into the NASDAQ as well. This dynamic is bullish for US risk-on assets and likely contributed to the strong push in the crypto markets over the weekend.
Currency Outlook: Euro/USD and DXY Dynamics
A notable pattern is forming in Euro/USD: a Double Inside 3-Week Candle Failure. This suggests the Euro may be topping out, implying near-term Dollar (DXY) strength, as the Euro holds a 57% weight in the DXY.
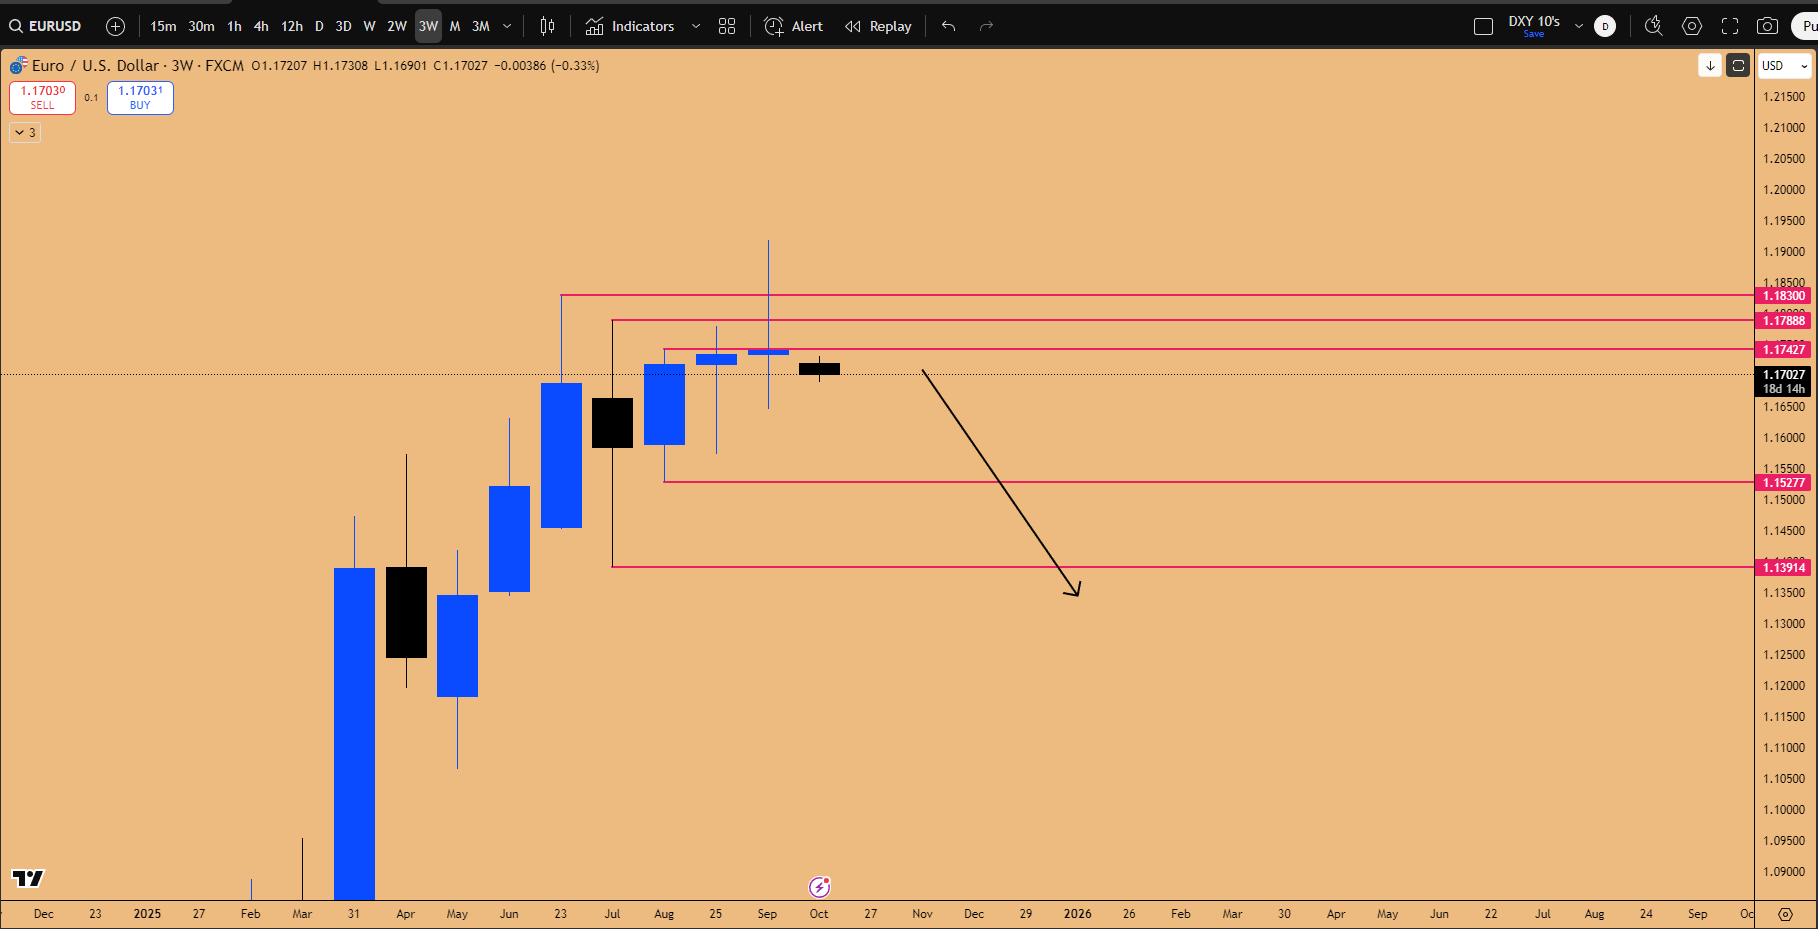
Figure 5: Inside 3-week Candle pattern in effect in EURUSD, primed for downside expansion
This DXY move is viewed as a counter-trend bounce, not a full trend reversal. The target for the bounce is the inside monthly candle low at 101. Once it reaches this level, the dollar is expected to sell off again, as impending rate cuts are ultimately bearish for the dollar.
Importantly, the correlation between DXY and risk-on assets is currently weak. A rallying dollar does not preclude risk assets from moving higher, as risk assets are primarily focused on pricing in upcoming rate cuts.
Commodities Super Cycle: Gold and Silver
Gold and Silver remain in a mega super cycle phase. Despite overbought conditions on the quarterly chart, this does not imply imminent deflation. When a bubble is forming, assets can remain overbought. We are not close to the triggers that historically cause gold to deflate; rather, we expect further inflation. Silver is also very close to making new all-time highs.
Mastering Market Cycles: The Quarterly and 3-Week Candle Strategies
A core component of our methodology involves using higher timeframe analysis to manage long-term positions, identify generational market shifts, and navigate trends with precision. This strategy, utilized successfully in crypto since 2018, emphasizes the importance of institutional behavior tied to quarterly and 3-week (3WE) timeframes.
The Quarterly Candle Strategy: Identifying Macro Trends
The Quarterly Candle Strategy provides a framework for riding entire bull runs once a bear market comes to an end, managing positions with zero stress over a 2-4 year horizon.
Navigating Bear Markets and Identifying Reversals:
Identifying the Bear Trend: A bull market remains intact as long as the previous quarter’s low is not taken out. A breach of a quarterly low is a hard stop loss, indicating the start of a bear market. In a bear market, the asset prints lower highs and lower lows on the quarterly chart.
Waiting for the Shift: Traders must avoid premature entries during bear market bounces. You must wait for the market to show its hand.
The Entry Trigger (BMS): The confirmation of a bullish reversal occurs when the market takes out the nearest lower high (the previous quarter’s high). This is the Break in Market Structure (BMS) to the bull side and the trigger to initiate spot long positions.
Riding the Bull Trend and Dynamic Stop Losses:
Identifying the Bull Trend: A bull trend is confirmed by the market printing higher lows and taking out previous quarter’s highs.
Trailing the Stop Loss: As the market expands higher, the stop loss is moved below the previous quarter’s low. This low acts as a “line in the sand for the institutions” and is typically not revisited during expansion.
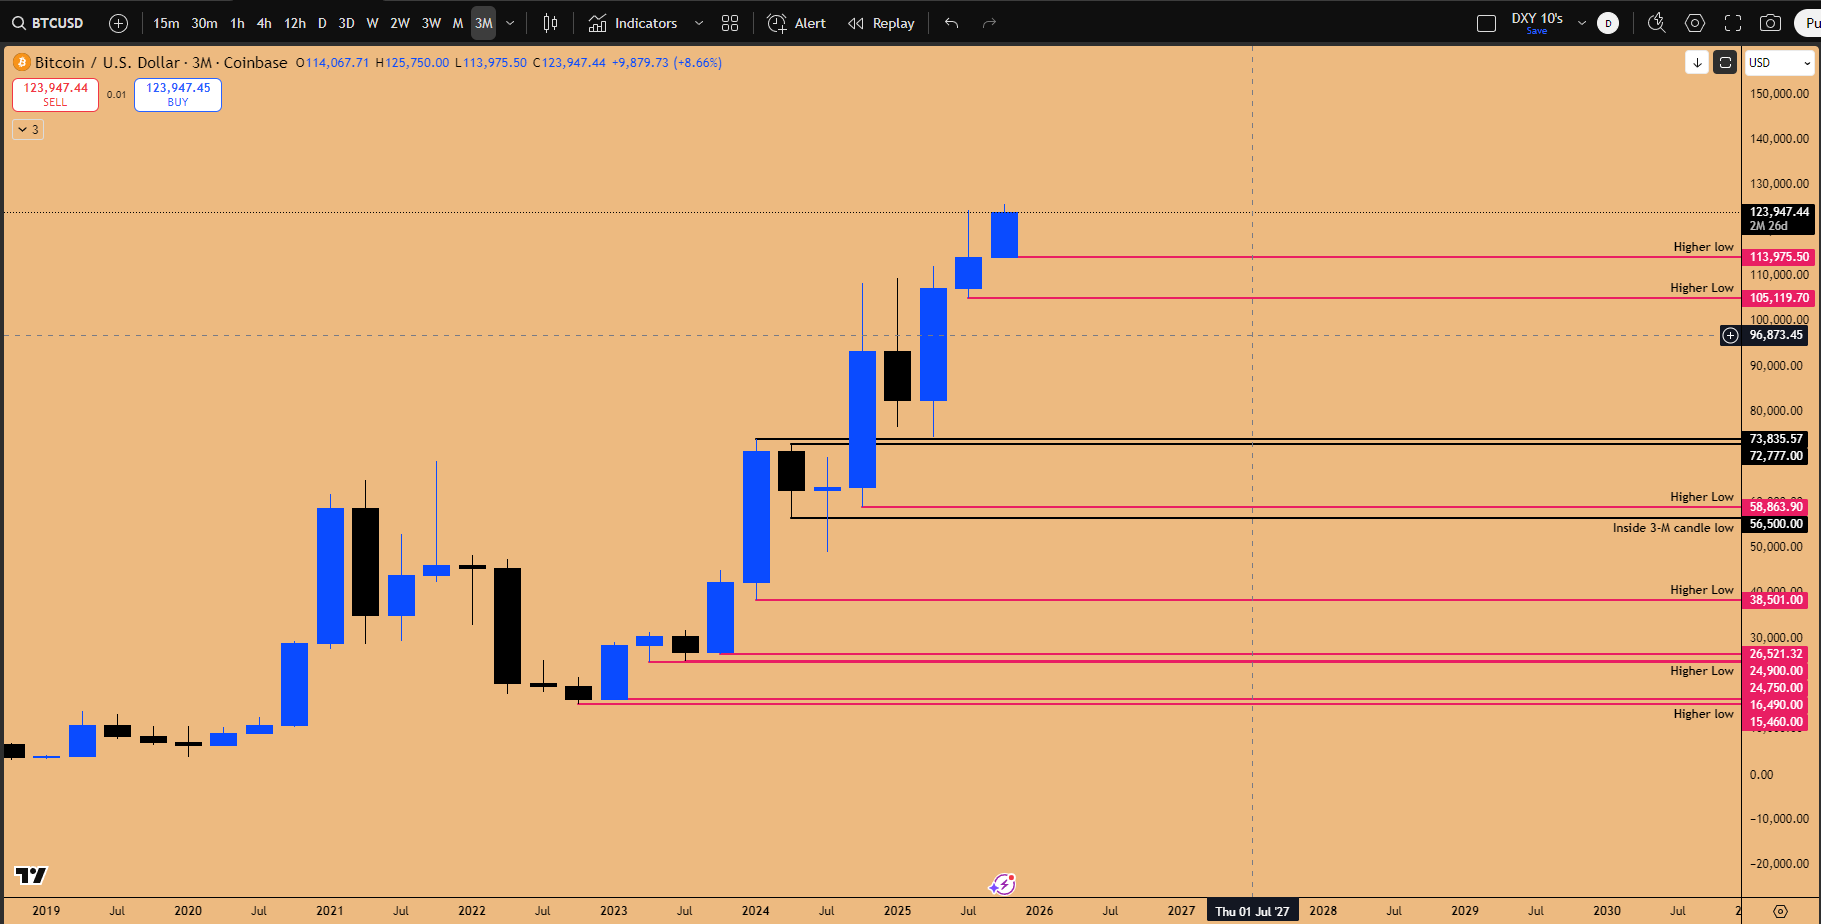
Figure 6: Applying Quarterly Position Management Strategy implemented on Bitcoin’s Macro Uptrend
Handling Inside Quarterly Candles and Stop Runs:
A critical nuance involves inside quarterly candles. When an inside quarterly candle forms, you do not move the stop loss to the inside candle’s low.
Allow for Stop Runs: You must give the market bandwidth, as inside candles often lead to stop runs (liquidity grabs) below the inside low before reversing higher (Inside Quarterly Candle Failure).
Wait for Confirmation: Wait for the next quarterly candle to confirm a breakout (taking out the previous high) before moving the stop loss below the low that facilitated the breakout.
The 3-Week (3-Week) Strategy for US Equities
The same strategic principles apply to US equities (including S&P 500 and NAS100), but the 3-Week timeframe is preferred. It provides a more actionable experience and offers earlier warning signs than the quarterly chart.
Microsoft (MSFT) 3-Week Analysis:
A historical analysis of Microsoft demonstrates the power of the 3-Week timeframe. The reversal occurred when the market took out the nearest 3-Week lower high. Since that bottom, Microsoft went up in a straight line without violating any of the previous 3-Week candle lows. Every 3WE candle close established a new invalidation level.
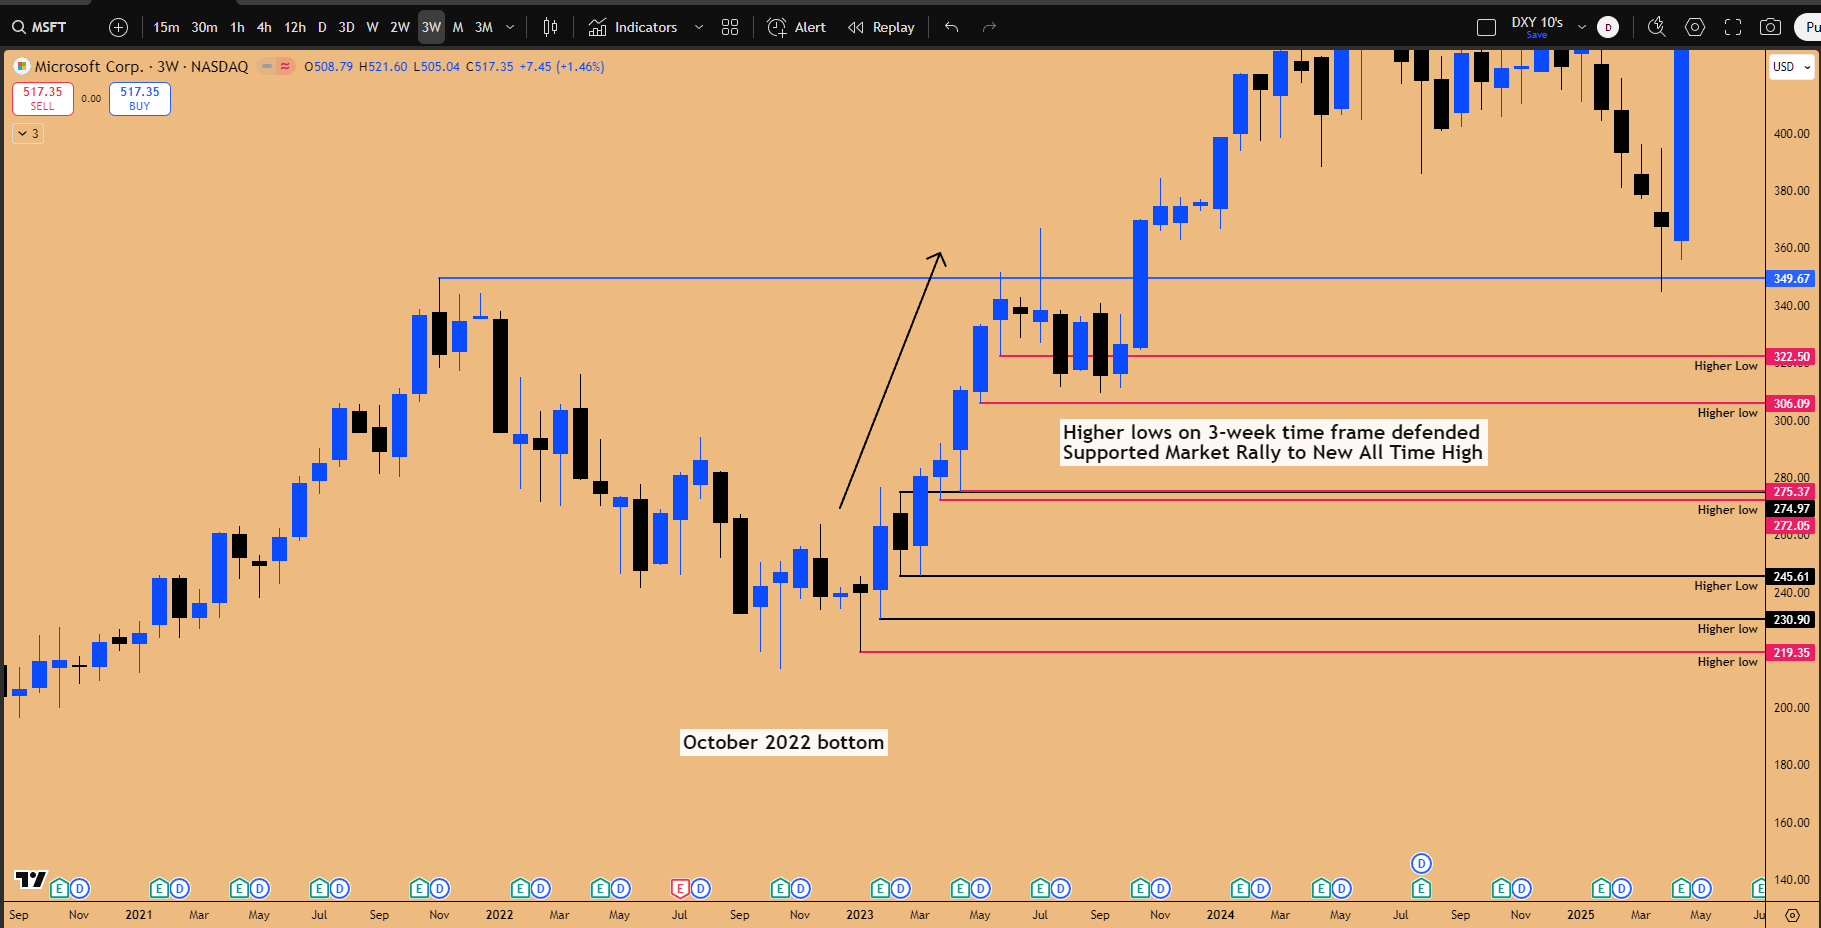
Figure 7: 3-week time frame position management strategy on MSFT
Aggressive Entries and VIX Capitulation:
In indices and risk-on assets like Bitcoin and NASDAQ, aggressive entries on the 3-Week chart often work well when downside liquidity is attacked within an inside candle structure. Furthermore, during market crashes, we monitor the VIX. Historically, anytime the VIX goes above 60, the market is in peak capitulation mode. At this point, the real risk is being outside the market, justifying aggressive long positioning at major support levels (like the previous all-time high).
Portfolio Management and Risk Allocation
Effective portfolio management requires differentiating between types of setups and understanding how capital is allocated across different accounts and risk profiles in a melt-up environment.
Personal vs. Prop Firm Risk Management
Risk tolerance and position sizing differ significantly between personal portfolios and prop firm accounts.
Personal Portfolio (Core Holdings): Used for options contracts (LEAPs), spot positions (ETH), ETFs (ETHA), and physical stock. These positions are heavier, reflecting long-term conviction without the constraints of daily loss limits. Example: If a portfolio is $100k, a 30% risk on Microsoft means a $30k position.
Prop Firm Accounts (Swing Trading): Used for leveraged perpetual contracts (e.g., XRP, Sui). Risk is constrained by prop firm rules (e.g., max 5% daily loss). Typical risk per trade is 1% to 2.5%.
Current Deployment Status (Q&A Insight)
The portfolio is currently positioned aggressively for the Q4 outlook, concentrated in high-conviction assets using personal capital.
Microsoft (MSFT): 30% allocation.
Netflix (NFLX): 10% allocation (Options).
Ethereum (ETH): 10% allocation (Spot/ETF - newly added).
Total Deployed: 50% deployed, with significant cash remaining for other opportunities (such as adding to ETH on a dip, or positioning in Costco/Meta later).
Key Takeaways and Outlook
As we move deeper into Q4, the market environment is characterized by a global melt-up, fueled by anticipated rate cuts and injections of liquidity, notably from Japan. The convergence of technical breakouts and bullish seasonality confirms that being positioned in risk-on assets is paramount.
Summary of Core Positions and Outlook:
Ethereum (ETH): The Inside 3-Week Failure has triggered a critical entry. Driven by the macro range breakout and the precedent set by BNB’s 70% rally, ETH is targeting $8,330. This is viewed as the last opportunity before a sustained move above ATHs.
Microsoft (MSFT): Our highest conviction play. MSFT is significantly lagging the NASDAQ and is expected to rapidly close the gap towards $600. The AI revenue explosion (ChatGPT/Sora 2) will likely drive a rally ahead of earnings.
Netflix (NFLX): A high-probability setup based on the Inside Two-Month Candle Failure. The October 21st earnings report is the catalyst, with options targeting a 170% return.
Global Macro: The Japanese elections are a major bullish catalyst. The expected devaluation of the Yen will drive USD/JPY to 152 and boost the Nikkei, flowing liquidity into the NASDAQ.
Strategy: The Quarterly and 3WE Candle Strategies provide the framework for managing these long-term positions, emphasizing the importance of respecting higher timeframe lows and institutional behavior.
If you’re finding value in our research, we’d like to extend a personal invitation to explore the next level of market analysis within our Speculators Trading community. Our Discord server is a collaborative space dedicated to helping traders optimize capital allocation. Inside, you’ll gain access to our real-time Trading-floor commentary, high-conviction technical setups, proprietary educational resources, and strategic bi-weekly livestreams. We invite you to experience these premium resources firsthand and see how they can enhance your portfolio management. Join us with a 14-day free trial (120 USD/month after trial is over), you can cancel anytime, but we would love for you to stay.
The risk remains being underweight. While managing risk dynamically, the focus is on capturing the explosive upside expected through Q4 and into 2026.
What’s your take on these setups? Are you positioned for the Ethereum breakout or the Microsoft catch-up trade? Share in the comments let’s discuss strategies. Subscribe for more market breakdowns!
Disclaimer: This isn’t financial advice – just market musings from the charts. Always do your own research.
If you enjoyed this deep dive, please share it with fellow traders!