

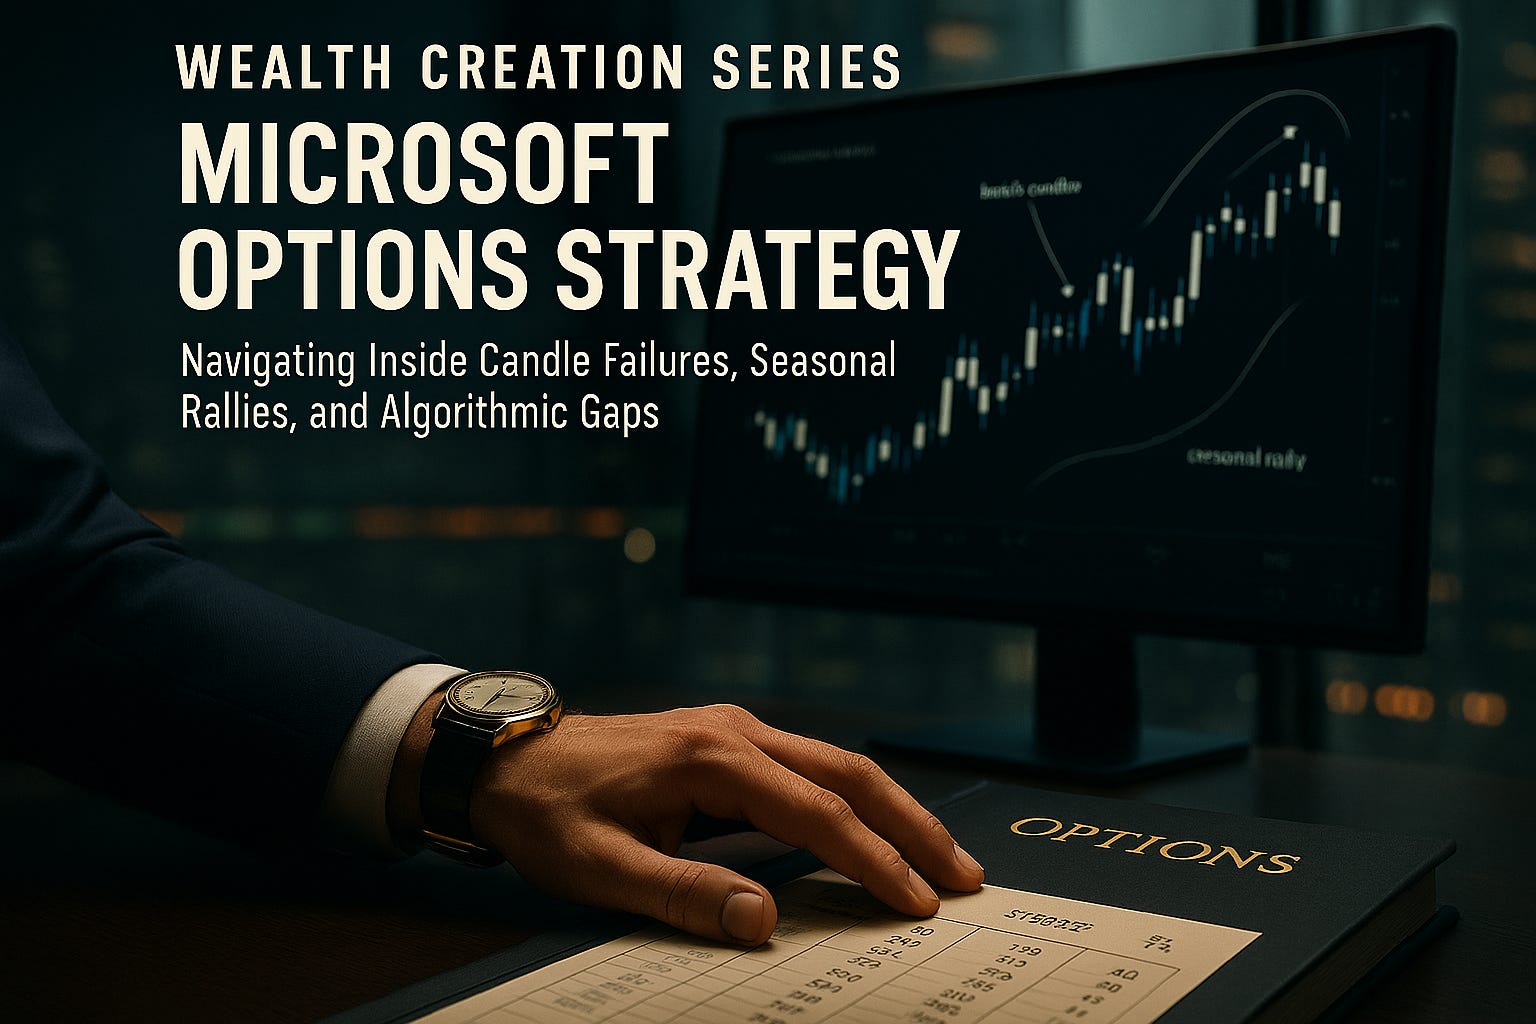
Wealth Creation Series: Microsoft Options Strategy
Navigating Inside Candle Failures, Seasonal Rallies, and Algorithmic Gaps

📌Executive Summary
In this week’s market deep dive, we dissect a high-conviction options trade setup in Microsoft (MSFT), exploring the intricate interplay between technical patterns, historical seasonality, and macroeconomic shifts. This analysis provides a comprehensive look at structuring an options trade designed to capture potential upside acceleration during Q4 and Q1, a period historically marked by strong performance due to consumer spending and portfolio reshuffling. We explore the specifics of the February 20th $550 call options, analyzing pricing scenarios based on different market movements, and critically, establishing firm risk management protocols. The core thesis revolves around a rare technical formation: the Inside Monthly Candle Failure. We examine the historical precedents of this pattern in Microsoft, noting its tendency to resolve to the upside, and compare it to recent explosive moves in Apple (AAPL) driven by similar consolidation patterns.
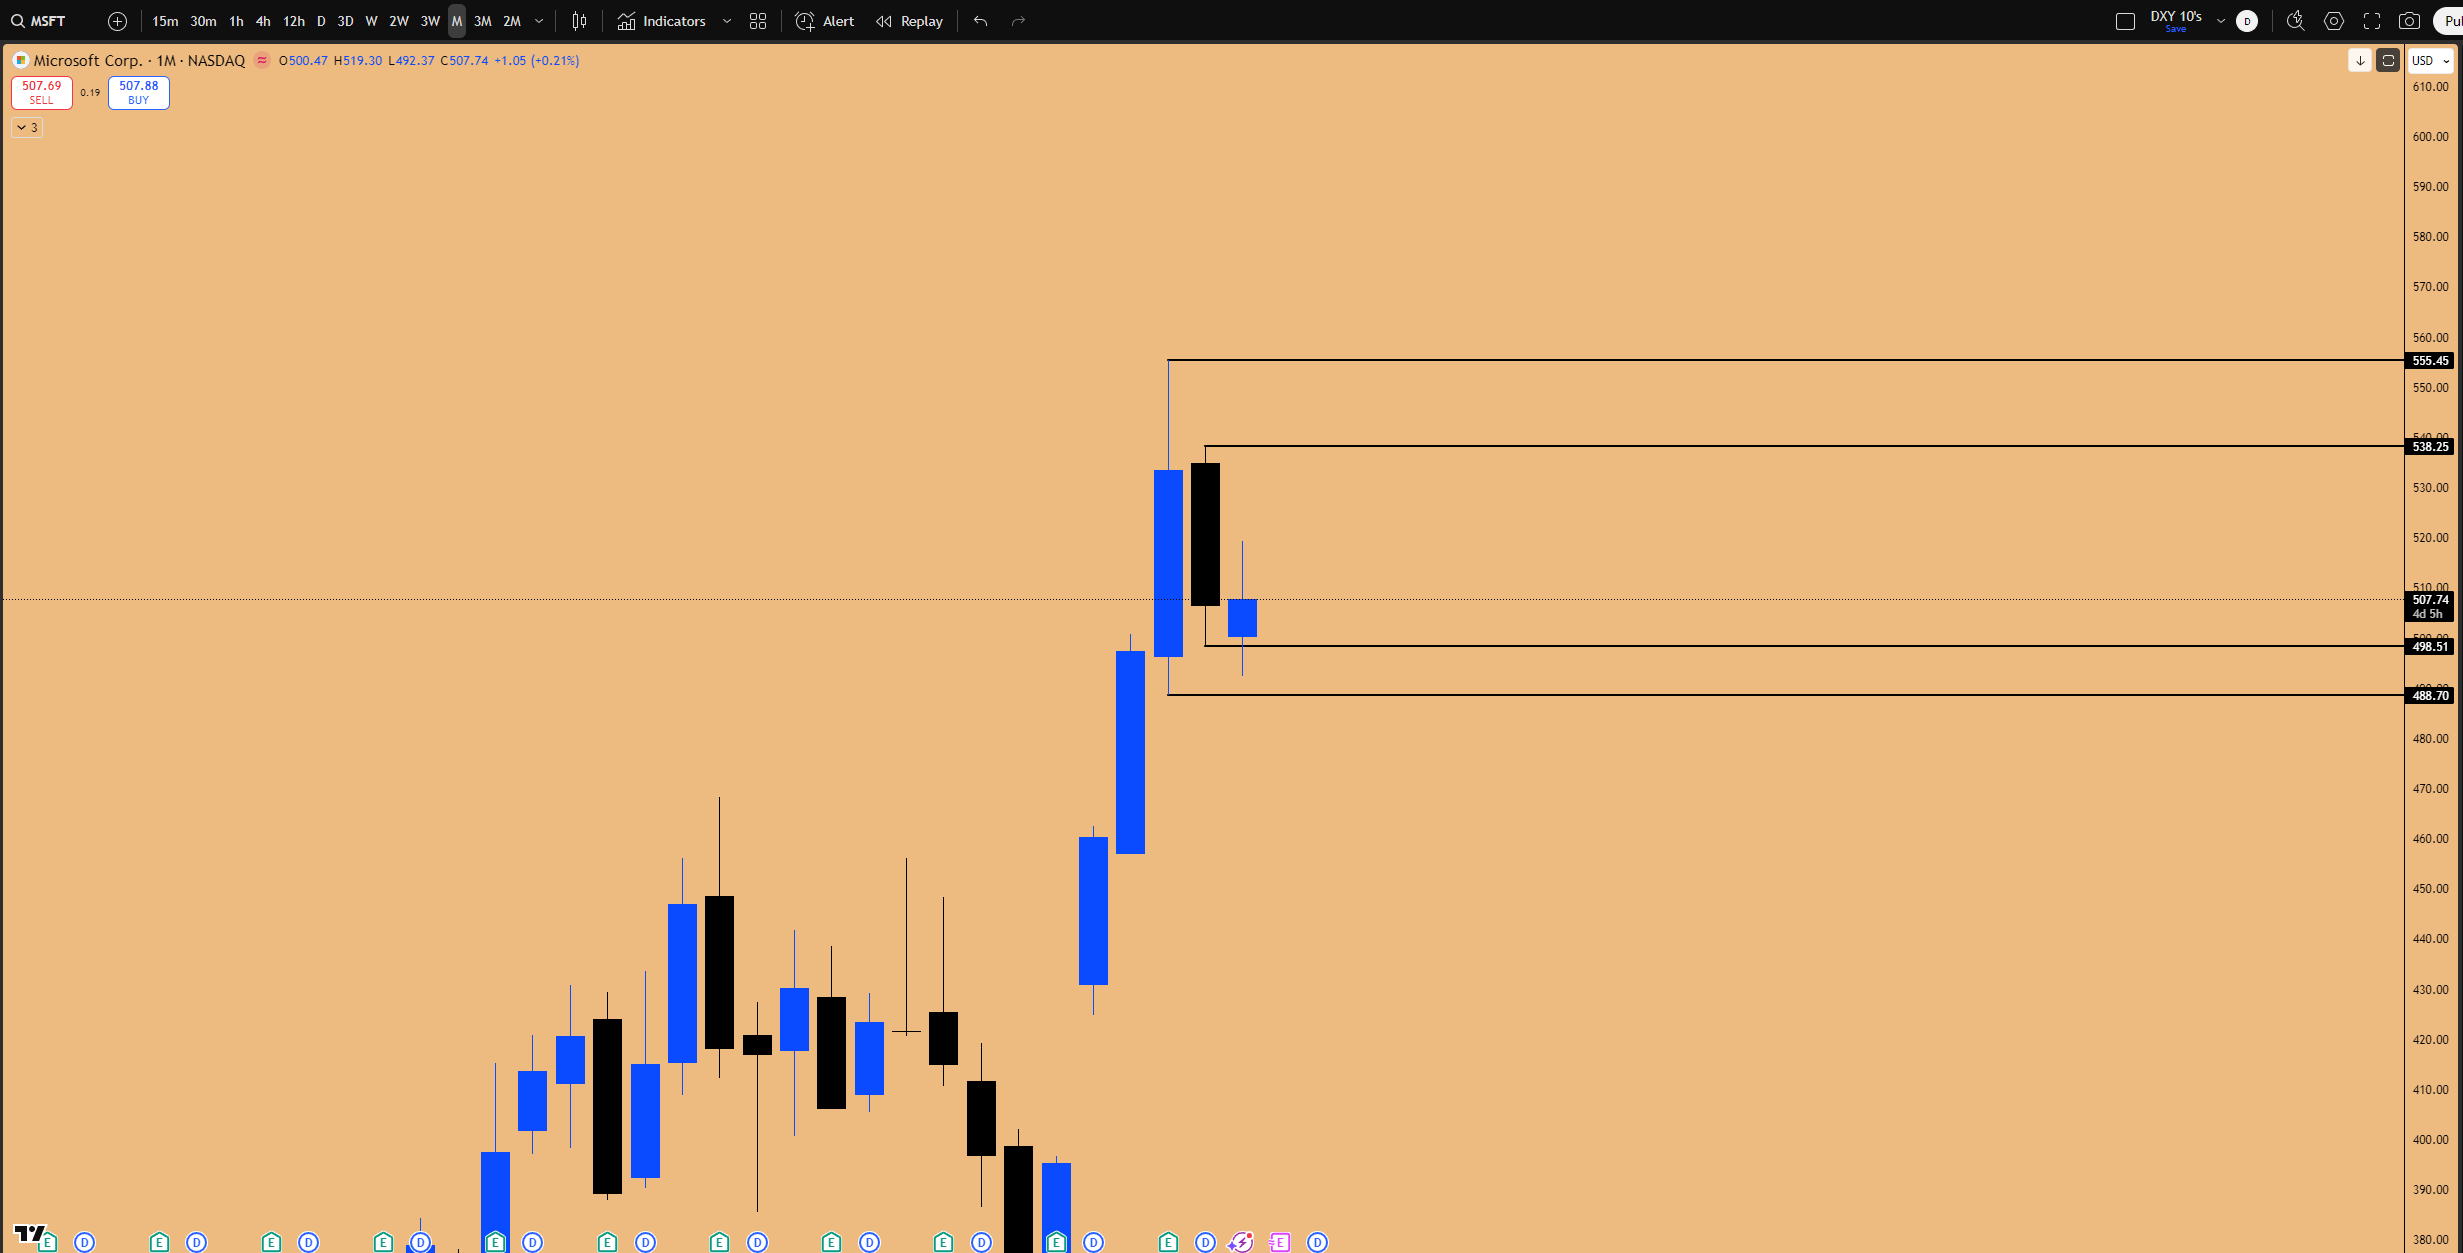
Figure 1: Inside Monthly Candle Failure pattern in formation
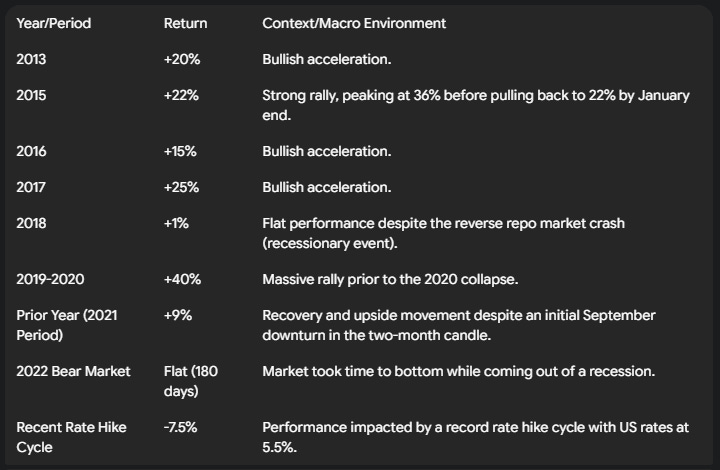
The discussion delves deeply into Microsoft’s historical performance from September through January, revealing returns ranging from 15% to 40% in bullish years. We contrast this with periods of flatness or minor negativity during macroeconomic distress, such as the 2022 bear market and the record rate hike cycle where rates hit 5.5%. Crucially, the current environment is shifting towards a rate cut cycle, suggesting a loosening monetary policy that could provide significant stimulus—a tailwind absent over the last two years. This macroeconomic backdrop strengthens the bullish technical setup.
Beyond the specific Microsoft trade, we expand into advanced trading strategies and market psychology. How do you navigate the fear of a crash versus the often-overlooked risk of a market melt-up? We analyze how institutional players may manipulate news narratives to support their large positions, emphasizing why technical signals often supersede fundamental noise. The analysis covers precise entry strategies, such as identifying Inside Daily Candle Failures below the monthly or quarterly open to catch the bottom wick of the candle, which has been discussed in detail during our Q3 Elite Strategy Guide. Furthermore, we explore the critical role of gap analysis in identifying market inefficiencies. Using examples from the S&P 500 (SPX) and the Bitcoin ETF (IBIT)—where a gap fill preceded a 42% rally—we illustrate how algorithms target open gaps, providing high-probability reversal points once these inefficiencies are filled. This exhaustive breakdown offers actionable insights for traders looking to leverage high-timeframe patterns for establishing directional bias and executing swing trades with conviction.
Key Highlights:
Microsoft Options Setup: Targeting all-time highs using February 20th $550 calls, with a defined stop loss at the $492 level (the last three-week candle low).
The Inside Monthly Candle Failure: A rare, bullish pattern currently forming on the MSFT chart, historically indicating upside resolution.
Seasonal Tailwinds: Q4 and Q1 historically show acceleration in MSFT, with past rallies delivering up to 40% returns between September and January.
Macroeconomic Shift: The transition from a record rate hike cycle to an impending rate cut cycle provides a bullish stimulus environment.
Gap Analysis: Understanding how open gaps on indices and ETFs (like IBIT) act as magnets for price and signal algorithmic reversals upon filling.

Ⓜ️ The Microsoft Trade Thesis: Technicals, Seasonality, and Options Strategy
The conviction behind the current Microsoft (MSFT) trade setup is primarily driven by technical analysis, based on what is observed in the market. The other stuff—fundamentals and the seasonality aspect—are more so secondary in nature. The primary thing is whether the strategy being deployed is giving a long trigger, and it is, necessitating precise execution and patience for the pattern to play out.
Analyzing the February 550 Call Options
We are observing the development of a specific options play: the February 20th expiration $550 call options for Microsoft. Understanding the potential pricing scenarios is crucial for setting expectations.
If Microsoft were to move significantly in the money—for instance, trading at $560 tomorrow—the contract pricing would reflect this immediately, with the ask price around 37.25 and the bid at 36.95. If it goes deeper in the money, such as $600, the value increases further. However, the expectation isn’t for an immediate move. The thesis posits that Microsoft will not only reach all-time highs but likely exceed them. This confidence stems from cross-market correlation; the NASDAQ index recently sat at all-time highs (or was two or three days ago), suggesting Microsoft, which typically moves hand-in-hand with the index, has already registered the fact that it should be trading at similar levels.
The Impact of Time Decay (Theta):
A critical consideration is what happens if the contract does not move significantly through October, November, December, and January. If Microsoft is trading near the $550 level (all-time highs) during the first week of February, the pricing structure will change dramatically due to time decay. Based on comparable expirations (like the October 10th example observed), the options pricing might look significantly lower, trading at about $8 to $10. This is an acknowledged risk, taken based on knowledge of market structure, order flow, cross-market correlation, and the technical patterns in general.
Risk Management and Defining the Floor
There is no such thing as an investment without risk. While the entry strategy aimed to capitalize on the recent sell-off—with the first position taken, a second position added, and averaging into the position around the $500 level—the risk must be clearly defined.
The critical floor for this trade is the low of the last three-week candle, sitting at approximately $492. If this floor were to be breached to the downside, the long position will be exited.
“I will not hold a long position anymore if that floor were to be breached at the bottom, which means I am still looking at it as an investment which has risk to it.”
The stop loss is strictly based on the pattern invalidation. If the price goes below this level, the position is cut, regardless of the realized loss (whether 10%, 20%, or 30%). This adheres to the principles of the inside bar strategy currently in play. If the pattern plays out as expected, the first draw on liquidity to the upside is $555.
Positional Structure:
The position is structured to manage expiration risk and capture potential quarterly expansions. Half of the position is held in the February expiration contracts, capturing the end of Q4 and the first half of Q1. The other half of the position is held in April expiration contracts, providing extended exposure. This allows the February position the entire month of January and half of February to materialize.
Q4/Q1 Historical Seasonality and the Rate Cut Catalyst
A key component of the bullish thesis is the historical performance of Microsoft during the last three months of the year (Q4) and the beginning of the new year (Q1). This period almost always features an acceleration, driven by two main factors:
Consumer Spending: Increased activity during the US holiday season.
Yearly Reshuffling: New portfolios being set up in January.
A historical analysis of Microsoft’s performance from September to the end of January reveals a strong tendency for upside movement, although macroeconomic conditions heavily influence the magnitude of these moves.
Historical Performance (September to January):
The Macroeconomic Shift:
The context of the recent negative performance is vital. The market was navigating a record rate hike cycle. Despite this significant headwind, it was noted that Microsoft only ended up just being negative 3% in one instance during this high-rate environment. Now, the landscape is changing dramatically. We are entering a period characterized by a rate cut cycle, where monetary policy is actually loosening. Over the next six months, anticipated rate cuts will cause stimulus in the market. This supportive environment was not present in the last two years, providing a strong tailwind for the current setup.
🔄 Decoding the Inside Monthly Candle Failure Pattern
The technical core of the Microsoft setup is the Inside Monthly Candle Failure, a pattern that requires careful analysis and historical context. While technicals are paramount, we must also consider potential risks. A thought experiment involves analyzing the downside risk, specifically an open gap on the monthly chart left by earnings. This gap is visible to everybody in the market. Why is it there? Because of the earnings which are sitting open. While the market could go down till there, doing so would require it to invalidate the bullish pattern that is forming.
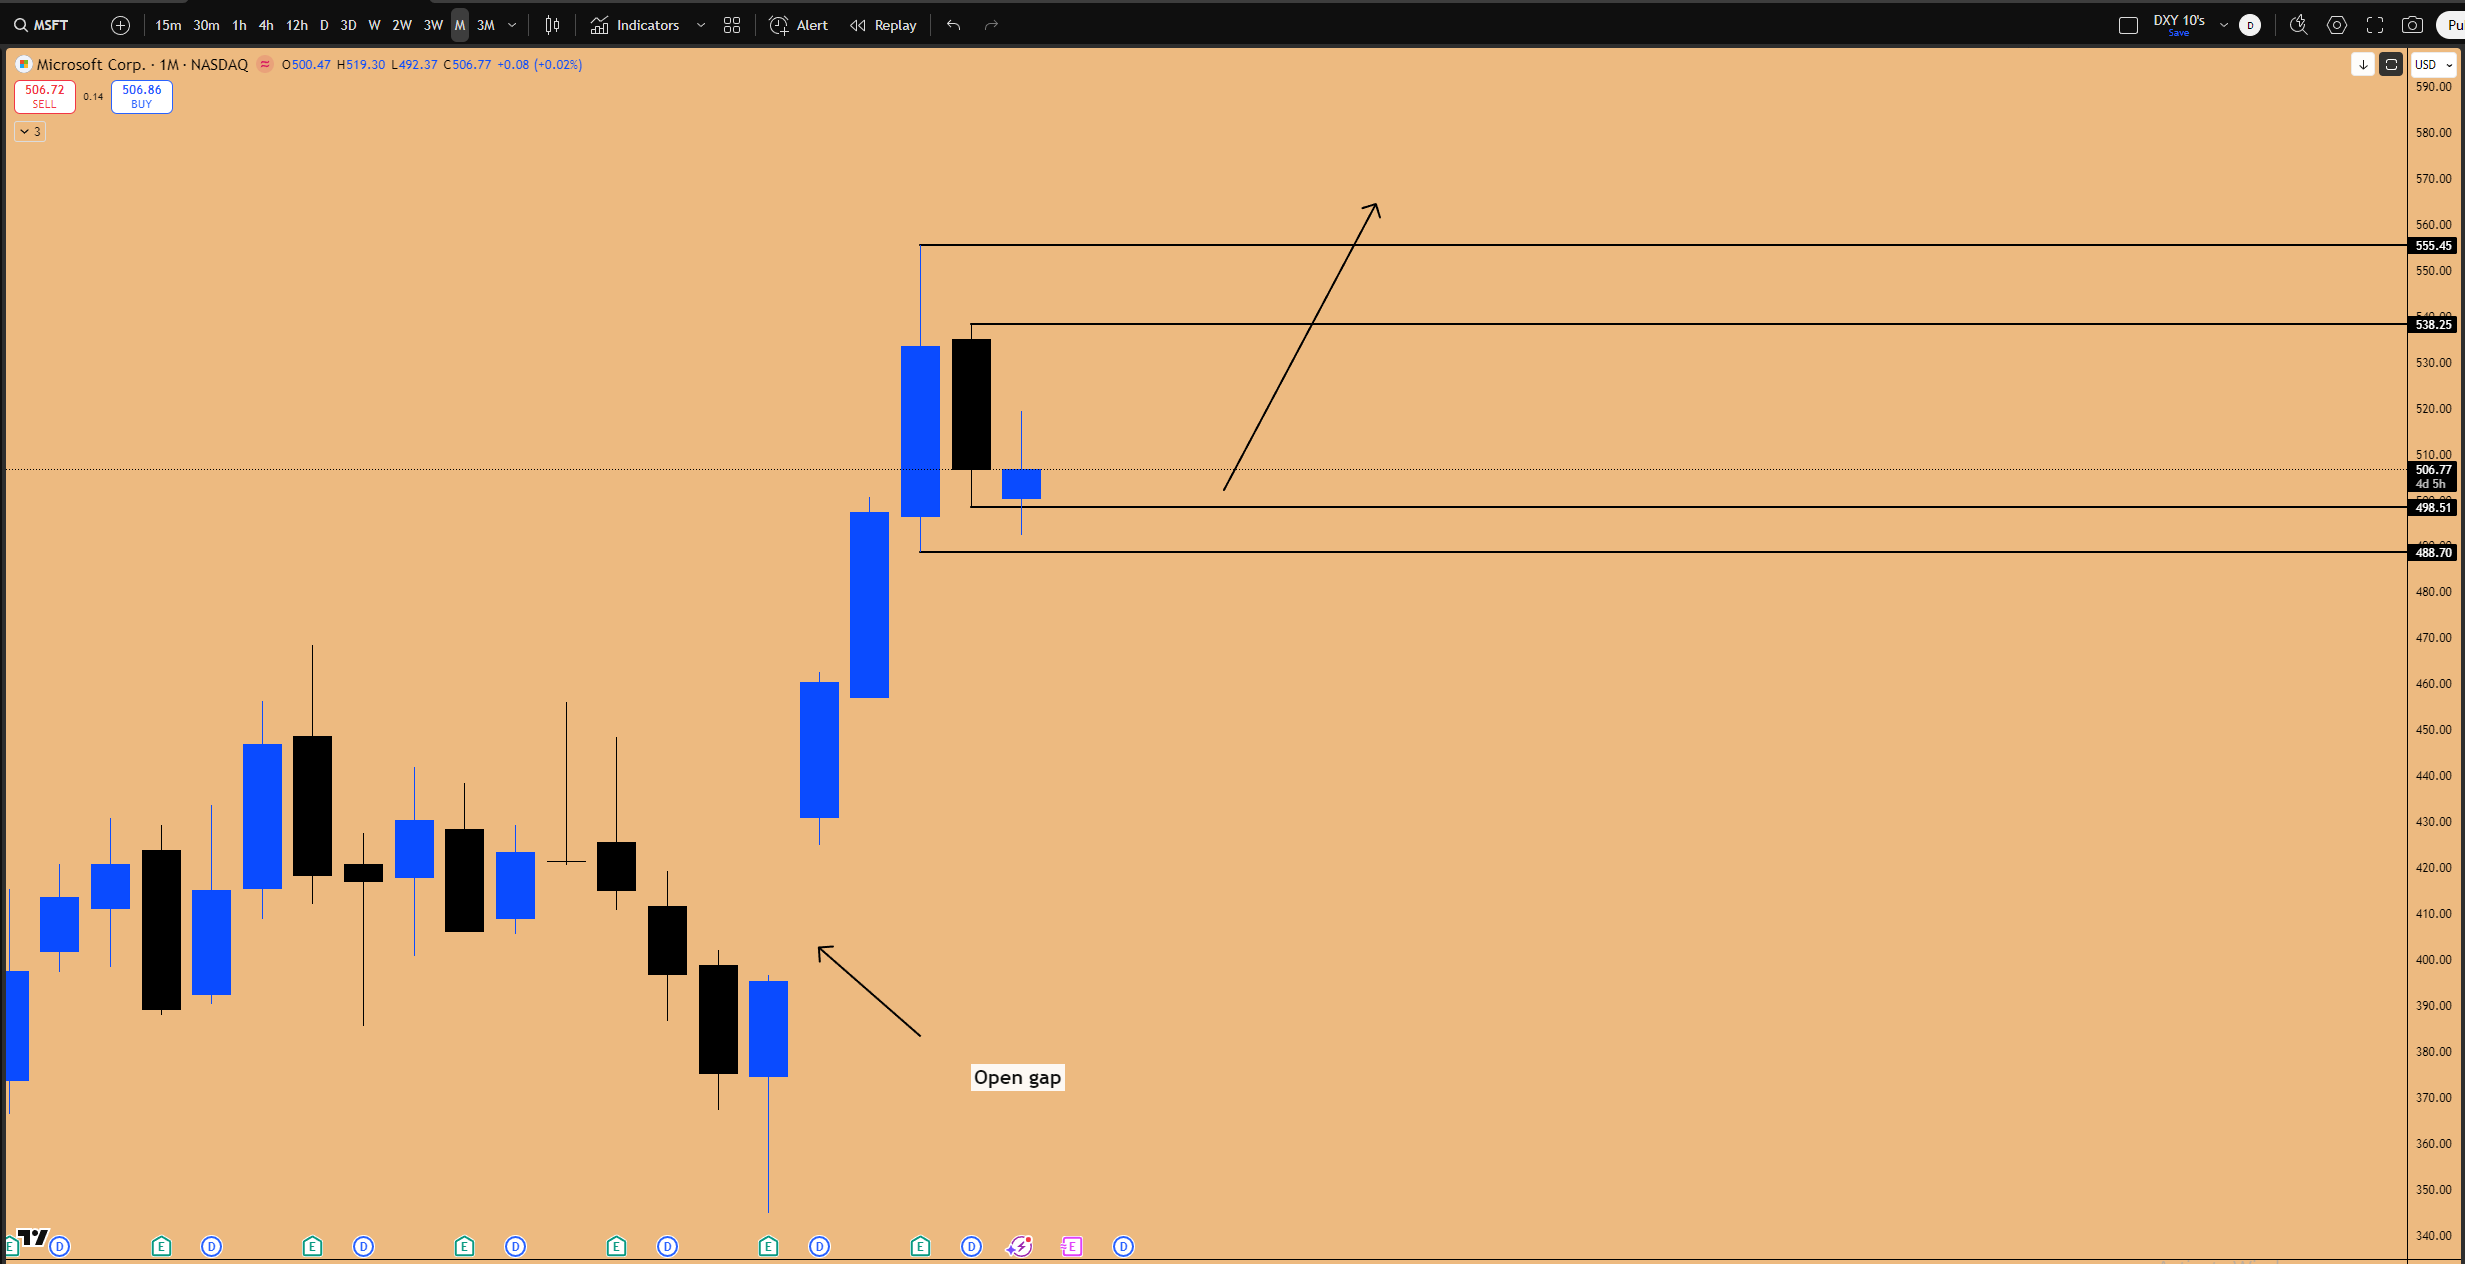
Figure 2: Open gap on the monthly time frame, which does not need to close anytime soon
The Current Setup and Immediate Hurdles
The bullish pattern in play is the inside monthly candle failure which is printing. For this pattern to be invalidated, the month of October would need to print a bearish candle to the downside, as the month of September is already done.
To close below the critical level and invalidate the pattern, Microsoft would need to go down another 2% to 3%. The question is whether this decline will occur within the next few trading days (Friday, Monday, and Tuesday), especially considering the broader market context. The NASDAQ has already undergone a 2.4% correction over the past three-day period. Chances are high that the NASDAQ will post at least one bullish day between now and Tuesday or Wednesday. That single bullish day could be enough to propel Microsoft higher along with it, confirming the inside monthly candle failure, pending some kind of news event the market did not see coming.
Historical Precedents: Post-COVID and Beyond
If the Inside Monthly Candle Failure confirms, the job as an analyst is to study every historical instance of this pattern, treating it independently of the general market returns during that period. These patterns are rare in Microsoft and do not happen usually.
A cursory look back to 2020 reveals the following instances:
Post-COVID Example 1: A proper inside monthly candle formed. It did not give a failure, as the wick did not take out the prior candle’s low. The next two to three monthly candles resolved to the upside, taking out the monthly high without even running the lows.
Post-COVID Example 2: Another inside monthly candle. In this case, too, it did not take out the liquidity to the downside and just went to the upside.
Post-COVID Example 3: An inside monthly candle which actually played to the bullish side, though nuanced. The initial inside candle closed at the low. The next monthly candle opened higher (gap up), went down, took out the low, and then went higher—this constituted a failure because it took out the low, closed higher. The month after that, it ran the upside liquidity, rejected it, and then started going down for the other side of the liquidity.
Key Observation: In all the cases mapped out so far for the inside candles, the upside liquidity has been taken out. Whether the market took out the downside liquidity first (creating the failure) was irrelevant to the eventual upside resolution.
The analysis uses the COVID pandemic as the reference point because that is when the market “started going on steroids” due to massive money printing and stimulus (e.g., the serves program, CARES Act, infrastructure spending bills, the big beautiful bill, US Treasury intervention with monetary policy, and deficit spending). Prior to COVID, it was mainly growth driving the stock price higher.
Pre-COVID Example:
Looking prior to the pandemic, one example stands out as similar to the current case. There was a proper inside monthly candle; the market took out the low, rejected it, and rallied significantly higher. Examining the weekly candles during this period reveals a bearish look initially. “When it dropped down, anybody would think that it is not going to go higher at all.” However, the market quickly reversed, creating a Weekly SFP (Swing Failure Pattern), retracing all of it within that one weekly candle and heading for the all-time high. That is how quickly Microsoft can go.
🆚 The Apple Comparison: Double Inside Candles and AI Fundamentals
The potential for explosive moves out of consolidation can be seen in the recent behavior of Apple (AAPL). How many people were calling that Apple is “done” because it is not doing anything with AI? Yet, Apple is sitting near all-time highs.
The move in Apple was driven by the breakout of a powerful technical pattern: the Double Inside Monthly Candle. It moved into extreme mode toward all-time highs based purely on stock buybacks which were happening and maybe something about AI which they will release next year. The market eventually figured out what exactly Apple is doing and is positioning accordingly.
This highlights a crucial principle: just execute on what the pattern is telling you, and the fundamental news, the new stuff, every other stuff, they all will just align with each other. The footprints of large institutions positioning in a stock are visible on the monthly chart through these large consolidations.
If Apple can execute such a move on short notice, so can Microsoft. Furthermore, Microsoft is a far stronger company than Apple from both a technical and fundamental perspective. Microsoft currently has active revenue streams coming from AI applications today.1 The reason Microsoft has the previously mentioned open gap but is not moving lower is that it actually reported record revenue growth, justifying its higher valuation. While the gap is an inefficiency in the market, it is a justifiable inefficiency. It will likely be filled eventually—perhaps two years down the road when the next recession happens when the market comes down another 30-40%—but it does not have to do it right now.
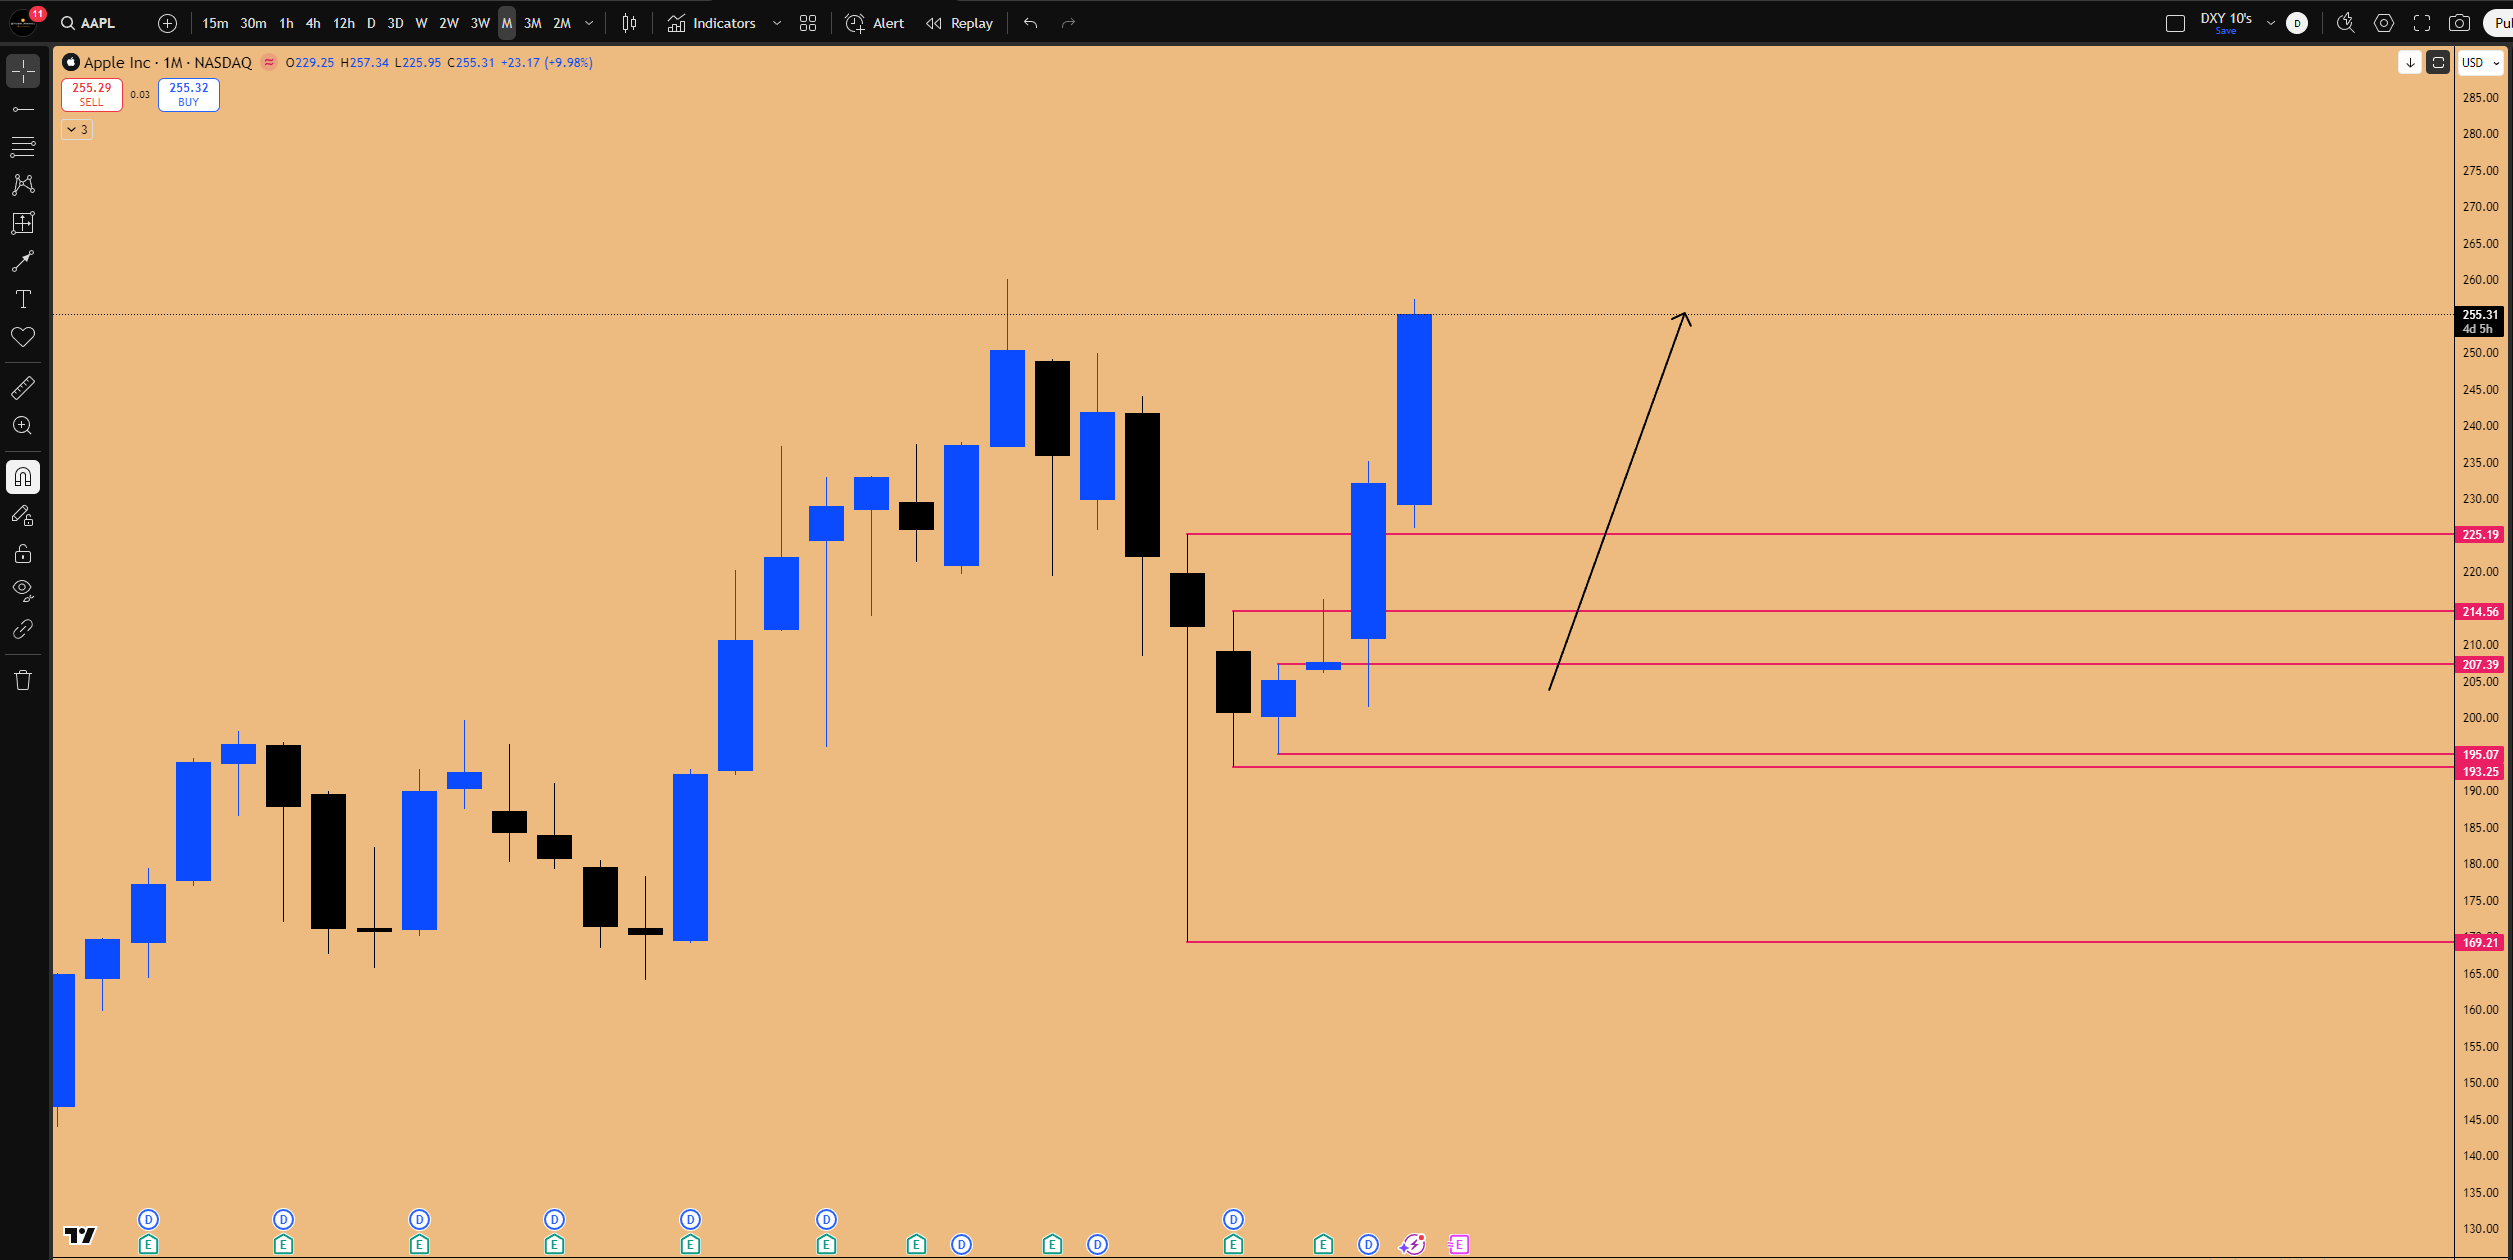
Figure 3: Inside Monthly Candle breakout in AAPL delivering 23% return!
Key Takeaway: While revenue is expanding and technical patterns support the uptrend, traders must execute on the technical pattern and ride it out. The risk management remains in place: the inside 3-week candle failure is also in play, meaning the $492 level acts as the running stop-loss and it should not go below there if it is bullish.
🏛️ Market Psychology: Fear, Melt-Ups, and Institutional Narratives
It is crucial to understand the psychological dynamics at play when significant patterns and consolidations occur. It is easy for the mind to think that the market may not go because it is not going in the moment. Emotions can flip easily, going into overdrive from extreme fear to extreme greed just based on price movement.
The Real Risk: Missing the Melt-Up
The primary concern with the Microsoft setup is personal: what if the pattern does play out and it goes to all-time highs but it does not stop there? What if it just keeps going higher?
“Everybody starts thinking about what if the market crashes? Nobody quite thinks about what if the market melts up? What if something gets injected in the market and it makes it go wild and nobody is positioned for it and everybody is sitting there thinking that I am just going to wait for the next crash because I want to buy cheaper. But the cheaper price never actually comes.”
The real risk is often not holding a long trade long enough to capture the entire uptrend if it actually starts going.
Institutions, News, and Manipulating the Narrative
Traders must understand how institutions think and operate, particularly concerning the dissemination of information. News can be organized and narratives can be pushed.
Institutions funneling hundreds of millions of dollars into their positions find it inexpensive to push narratives that favor their trades. If an institution has a $100 million position and expects a $20 million profit, spending $50,000, $100,000, or even $200,000 to influence news outlets is negligible.
“It is literally going to a cafe and you see a lineup of people trying to buy coffee for $2 and you go I have $1,000 in my pocket why can I not spend $20 and skip this entire line and get my coffee that is how institutions think when it comes to spending for narratives or whatnot.”
This is why technical analysis often takes far higher precedence than whatever the news might be telling the market should be doing. If you do not think the way institutions think, then you are at a losing game; you have a losing hand at the table.
Advanced Trading Strategies and Q&A
The discussion transitioned into specific strategies for trade entry, the importance of gap analysis, and establishing directional bias based on high-timeframe analysis.
Entry Triggers: Catching the Monthly Wick
Viewer Question: If you are looking for a long on a bullish inside pattern and the low side is not taken out (no failure/sweep), when do you look for entry and where are you looking to set your stop?
Response:
The entry in that case is going to be based on the market structure which is developing on the daily chart. If the high timeframe pattern (e.g., monthly inside candle) does not provide a clear trigger like a sweep of the lows (as the current MSFT setup did), and there is no trigger on the daily chart, you do not have to enter at all.
However, a specific playbook can be deployed when expecting a bullish month or quarter, aiming to catch the very bottom of the candle’s wick.
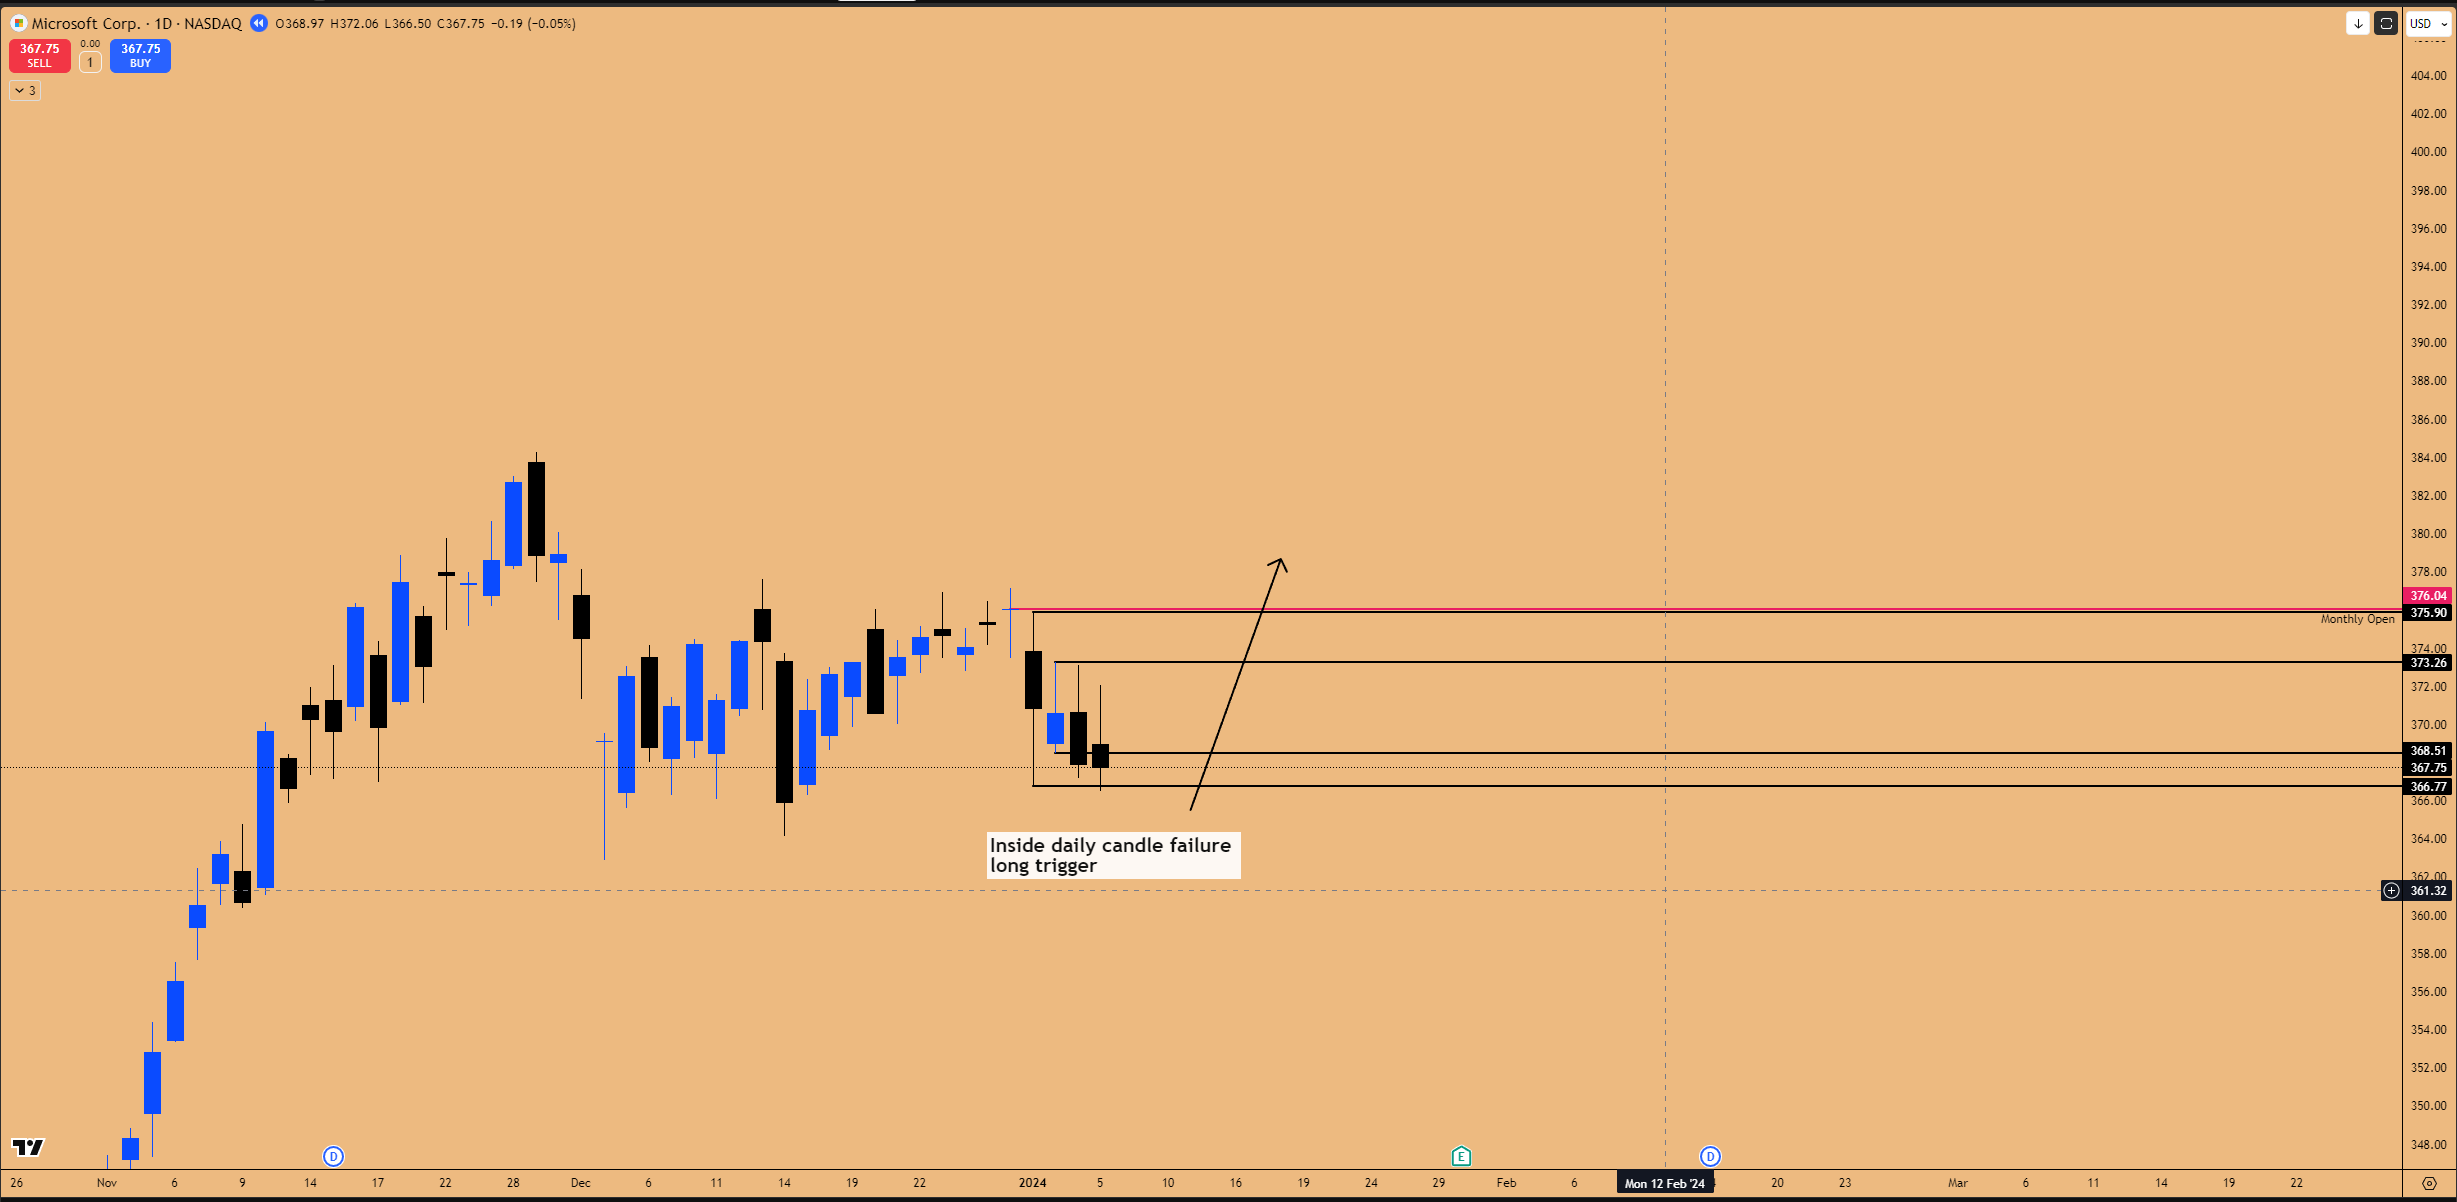
Figure 4: Inside daily candle failure confirmed as market dips from Monthly open/Quarterly open level
The Quarterly/Monthly Open Strategy:
This strategy is particularly effective at the start of a new period, such as January (which is both a new month and a new quarter).
Expectation: Anticipate a bullish month/quarter.
Initial Movement: Right off the bat when the monthly/quarterly candle opens, the market moves down, trading below the open.
Pattern Recognition: Look for Inside Daily Candle patterns forming at the bottom, below the monthly and quarterly open.
The Trigger: If the inside daily candle pattern gives a failure (takes out a low and reverses, forming an SFP), that is a strong long trigger.
This setup provides a high chance that the market is posting the bottom wick of the entire monthly or quarterly candle. That is how you get in at the low of the month.
Example Analysis (continuation below): In a historical example analyzed (January open), an inside daily candle failure provided a long trigger. The stop-loss is placed below the SFP low, and the take profit is above the recent high. This entry often coincides with a market structure break (confirming a higher low in comparison to previous higher lows) signaling expansion.
Holding the Trade: Once the market starts reclaiming the monthly open and the quarterly open, it is most likely that the initial downside price action was indeed the bottom wick. If the monthly candle is 30 days long and it spent 3 or 4 days forming the downside wick, it is likely going to spend the remaining 27 days moving to the upside. You can hold that trade without having any fear whatsoever that it is going to come down and take out that low because you basically caught the bottom end of the monthly candle.
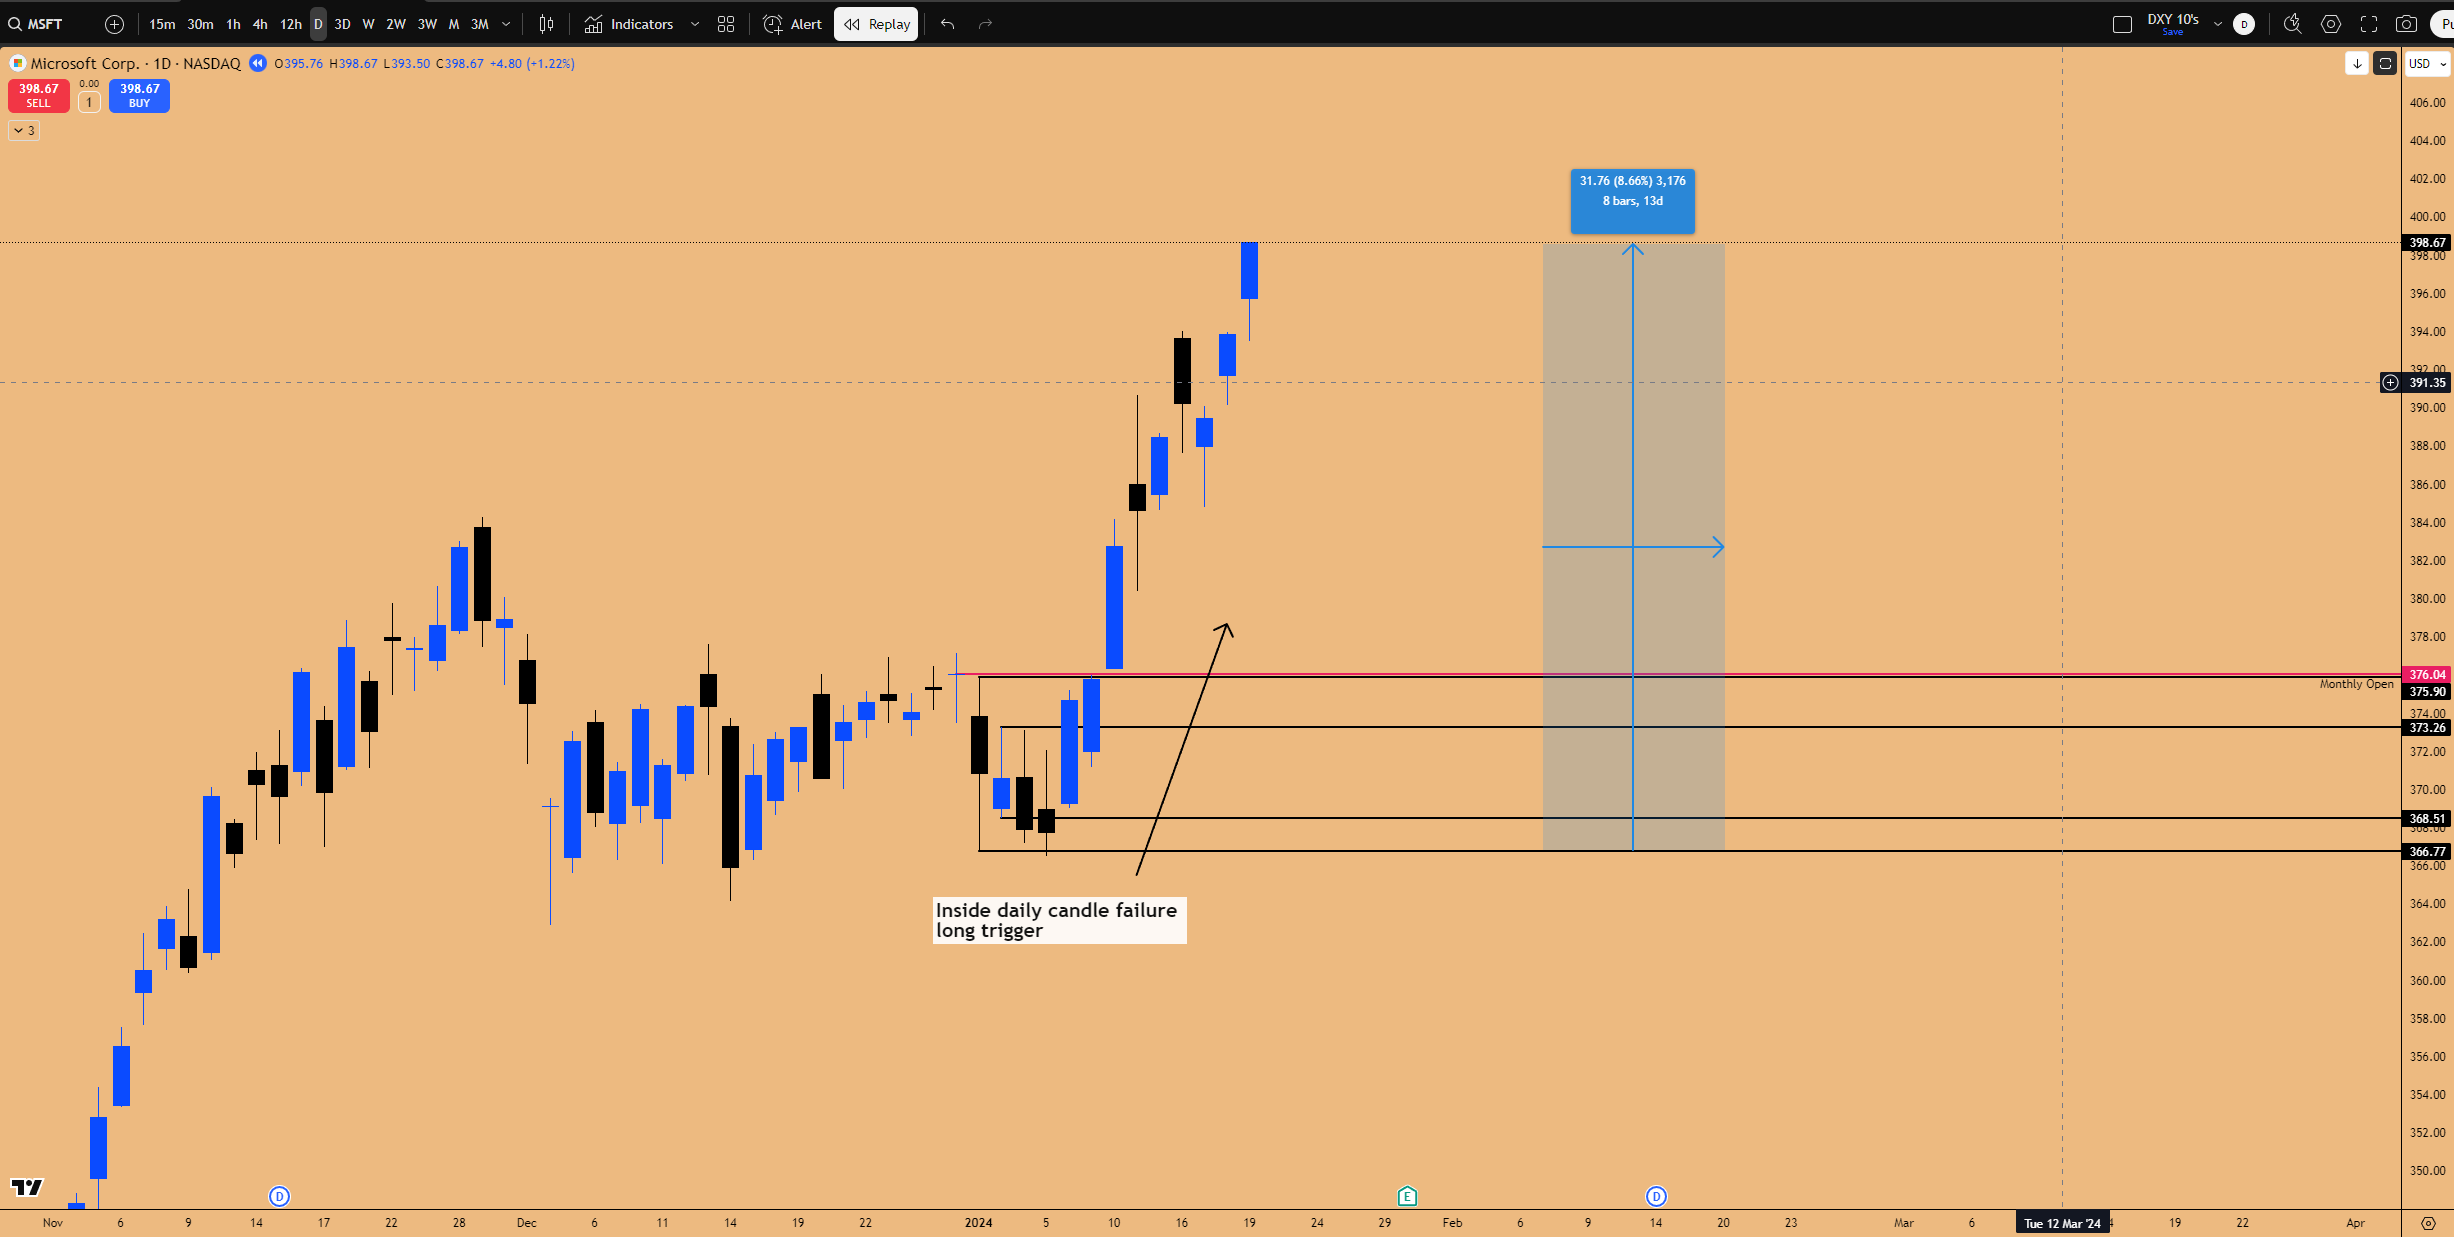
Figure 5: Continuation of bull trend higher after price reclaims Monthly open, post Inside Daily Candle Failure pattern’s long trigger
📐The Significance of Algorithmic Gaps (SPX, IBIT Examples)
Viewer Question: Discussion on the importance of gaps and which charts are best for analyzing them (e.g., BTC futures vs. ETFs).
Response:
Yes, you should definitely pay attention to what gaps are saying. For assets like Bitcoin, it is recommended to look at the ETF (e.g., IBIT) over BTC futures, especially on higher time frames. The ETF is responsible for bringing institutional investment into the Bitcoin market.2 Gaps on ETFs and cash indices (like SPX 500 index for the S&P 500) are highly significant.
How Algorithms Treat Gaps:
Gaps represent inefficiencies in the market. Algorithms are programmed to target these inefficiencies.
When a gap gets filled, that is the indication to the algorithm that it has filled the inefficiency and it needs to go higher.
Corrections are generally the market coming down to fill some kind of gap. Larger corrections target major gaps.
The Timing of Gap Fills:
A common confusion is the expectation that gaps must be filled immediately. The market does not have to fill them immediately; they can remain open for a month, two months, three months. However, the market always remembers that the gap is open and sitting there. When a future drawdown or recession occurs, that open gap is the first thing the market is going to attack.
Examples in the S&P 500 (SPX/ES) and NASDAQ:
Future Target: A gap remains open on the ES (S&P futures) chart at about 5700. In any future drawdown, the market is most definitely coming for this gap. When it gets filled (could be a year down the road, six months down the road), it will be an amazing place to go long.
Historical Fills: A previous NASDAQ drop came down all the way to an open gap, tagged the level right to the tick, and just rose with the upside. This is very common, not an isolated random event.
COVID Crash: The entire crash happened with a large open gap sitting above. Traders should have known that once the market bottomed, it would eventually go all the way back up to fill that gap.
2022 Bear Market: A very large gap was present on the cash index (SPX). Even though the market spent a lot of time going down and bottoming, it eventually rallied higher specifically to fill that gap, which acted as the next magnet for price.
Trading Gaps with Market Structure:
Gaps provide targets, but entries should be based on market structure. When a gap is posted in a bearish market (e.g., a series of lower highs), you do not automatically go long. You wait for the market structure to shift (e.g., breaking a lower high to make a higher high). Conversely, if the market starts breaking higher lows, you should not be sitting in long positions; you should be looking to short because the entire market structure is still bearish.
The IBIT (Bitcoin ETF) Example:
IBIT behaves like an index. Open gaps on IBIT will be filled and will not remain open for long. A significant example was an open gap on the weekly chart. Weekly chart gaps are massive inefficiencies.
When the market rallied after leaving this gap open, it did not take long for the market to come back down and fill the gap precisely. The market formed a bottom right there and then went higher. While observers blamed the sell-off on market capitulation due to external factors (like Trump raising tariffs), the actual reason the market bottomed was that it had filled the inefficiency. The entire premise or the entire reason for the market going down was justified. It was fulfilled. With that reason over, the market had no reason to go down anymore.
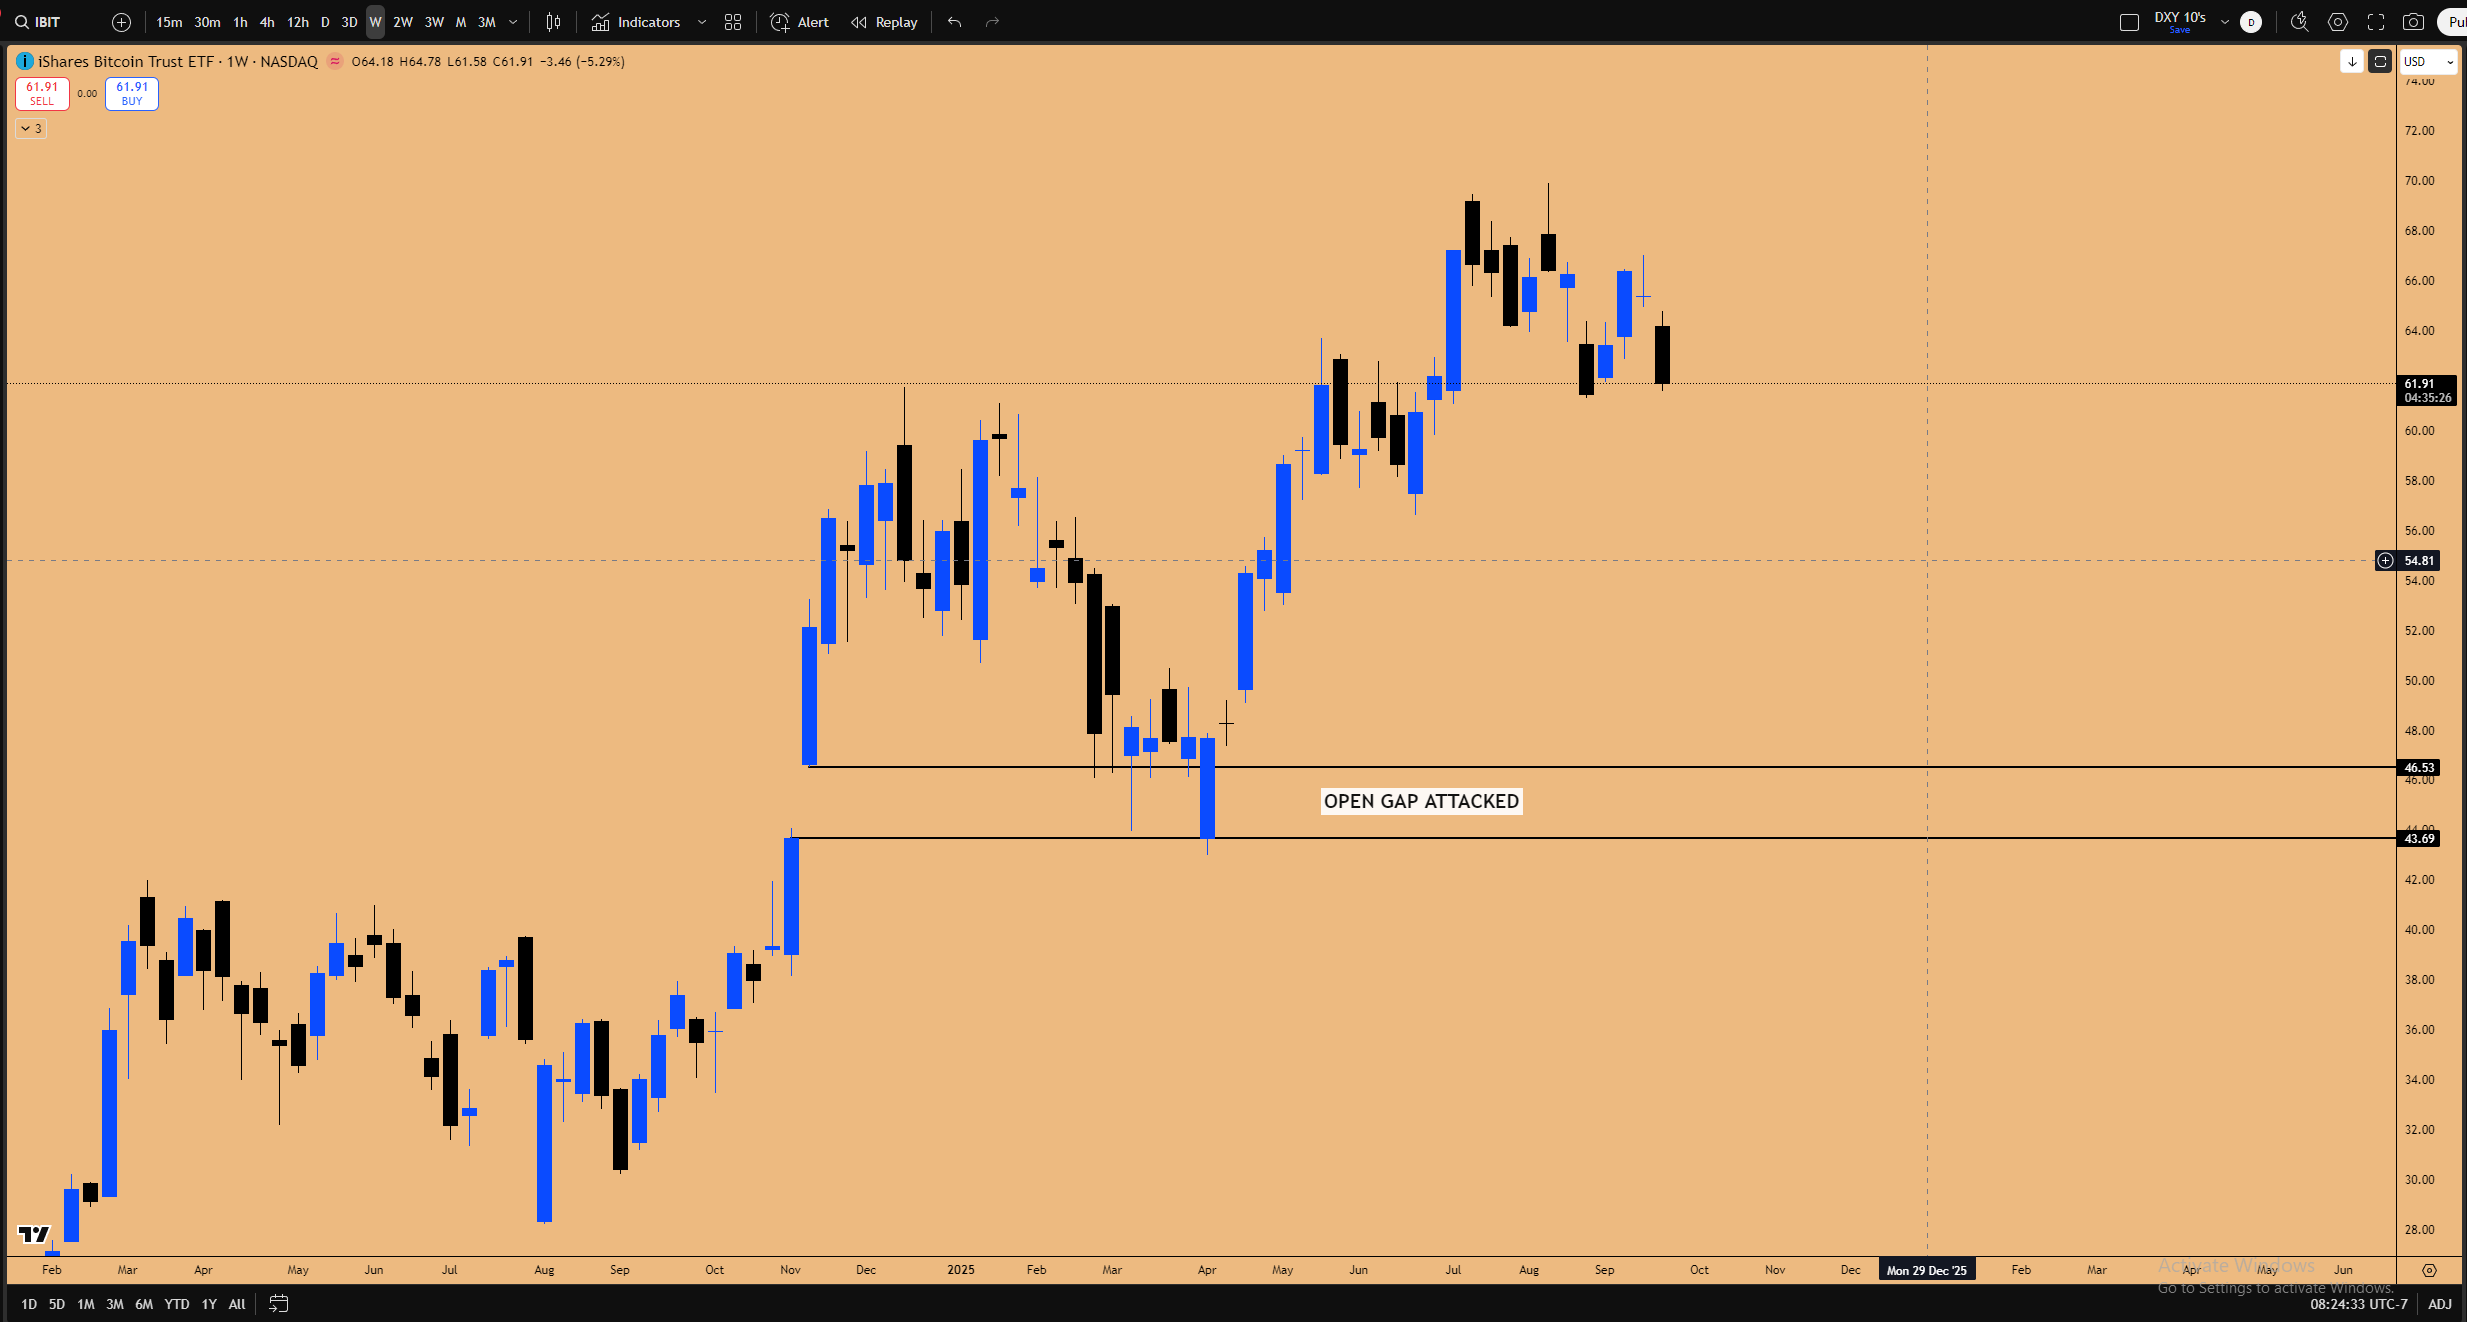
Figure 6: Open gap on the weekly time frame got filled before resuming bull trend higher
Key Takeaway: When you start looking at the market from the perspective of what the algorithm is trying to achieve (filling inefficiencies), it becomes easier to navigate than focusing on news, monetary policy, or economic reports (CPI, jobs reports). If a gap gets filled, the algorithm is going to act on it and defend the level. Every other force in the universe is going to come in sync and try to defend your idea (e.g., a supportive tweet, Treasury comments, a new spending bill). In hindsight, the market rallied 42% higher from that IBIT gap fill. The technical signal took precedence over the news narrative.
Establishing Directional Bias with High Timeframe Patterns
Viewer Question: Discussion on establishing directional bias in trading.
Response:
Directional bias is a tricky concept. Most of the time, nobody even knows what the price is going to do or where it is going to go. Trading involves using information from multiple sources and strategies to make an educated guess that the market will target untapped liquidity or an open gap, supported by market structure.
The most effective method for establishing directional bias is identifying patterns on higher time frames (weekly, two-week, monthly, quarterly charts).
Fractal Nature of Price:
Patterns like the inside candle operate similarly across all time frames from a liquidity perspective. For example, an inside daily candle failure (taking out the upside liquidity, rejecting, and coming down) indicates a draw on liquidity to the downside (e.g., 0.5% downside to cover).
If you spot these patterns on higher time frames, you can capture much larger movements, framing swing trades that can be held for weeks and weeks out.
Example: Two-Week Inside Candle Failure: A successful trade was executed based on an inside two-week candle. It started printing a failure when it closed back inside the range after a stop-hunt to the downside, shifting the market structure up. This provided a high-conviction directional bias, indicating 6% upside potential.
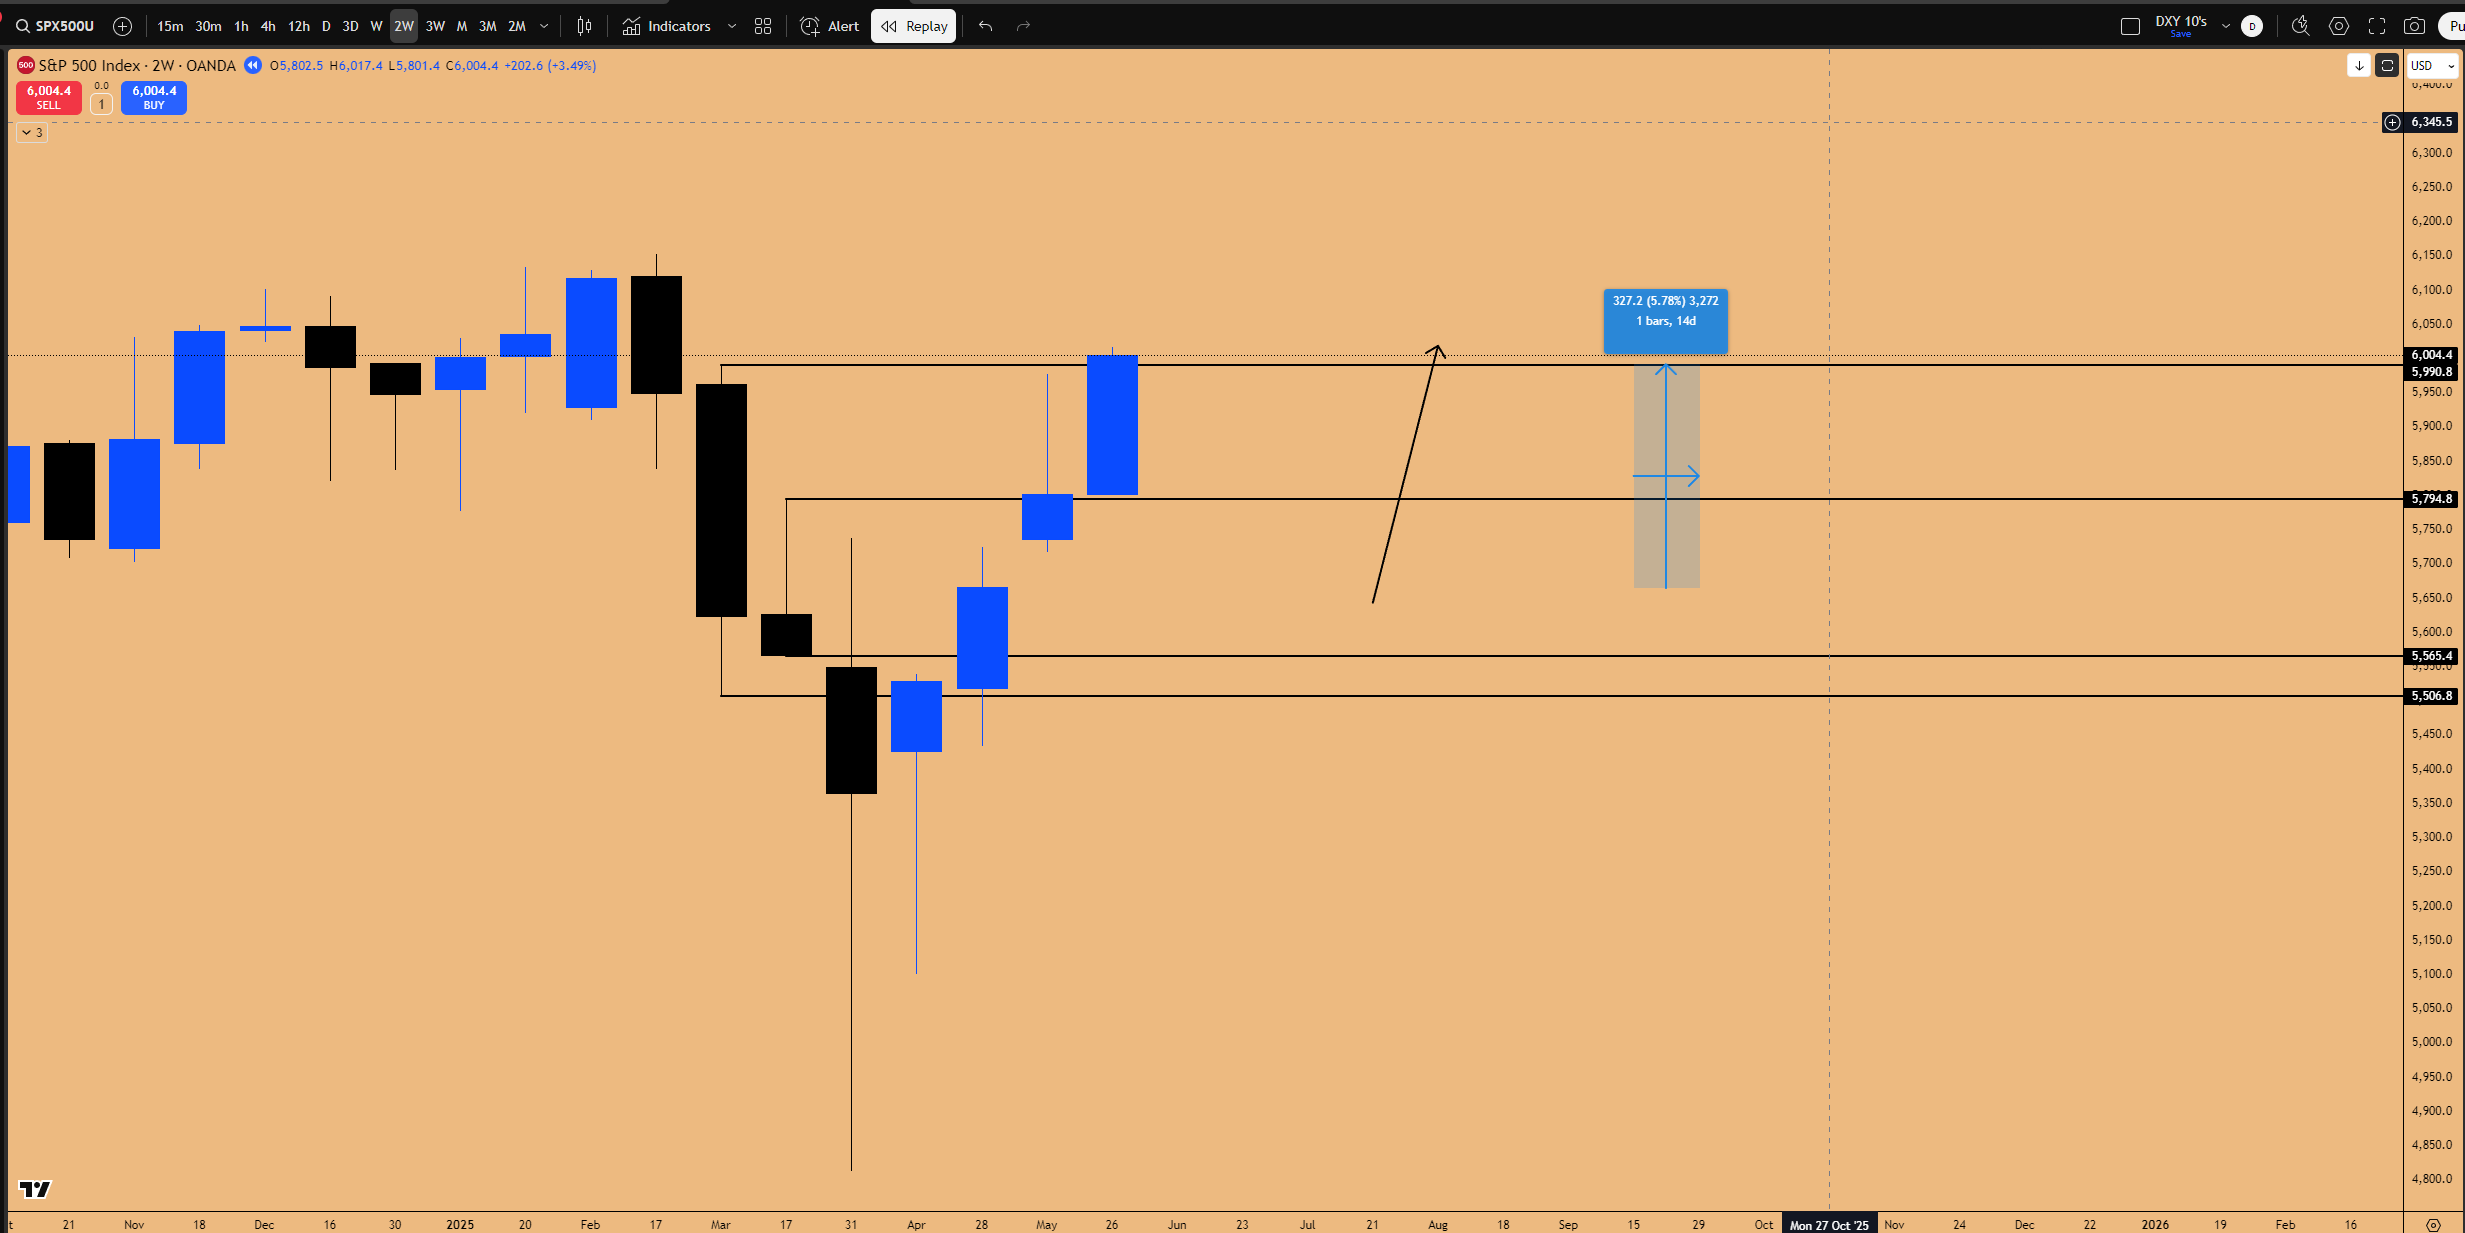
Figure 7: Inside 2-week candle failure delivering 5.8% directional return
Key Takeaway: Knowing that a high timeframe pattern is in play allows traders to frame setups on lower time frames (daily, intraday) aligned with that direction. This approach exceptionally assists in finding directional bias in the market.
💡 Key Takeaways and Outlook
This analysis provides a robust framework for approaching the current market, focusing heavily on the Microsoft options trade setup. The thesis relies on the convergence of a rare technical pattern—the Inside Monthly Candle Failure—and strong seasonal tailwinds, further supported by a macroeconomic shift towards a loosening monetary policy. The risk is clearly defined with a stop at $492, targeting $555 and beyond, leveraging the historical tendency for Q4/Q1 acceleration which has previously yielded up to 40% returns.
Traders should prioritize technical signals over news narratives, recognizing the potential for institutional manipulation. The strategies discussed highlight the importance of precise entry techniques, such as using daily inside candle failures below the monthly open to catch market bottoms. Furthermore, gap analysis remains a critical tool for identifying algorithmic targets and high-probability reversal zones, as demonstrated by the SPX and the 42% rally following the IBIT weekly gap fill. Establishing directional bias is most effectively achieved by identifying and executing on high-timeframe patterns, allowing for significant swing trade opportunities.
As we approach the end of the quarter, watch closely for the confirmation of the Microsoft monthly pattern and the broader market’s reaction to the changing interest rate environment. The next quarterly outlook will be on September 30th.
What’s your take on the Microsoft setup and the power of gap analysis? Share in the comments—let’s discuss strategies. Subscribe for more market breakdowns!
Disclaimer: This isn’t financial advice – just market musings from the charts. Always do your own research.
If you enjoyed this deep dive, please share it with fellow traders!